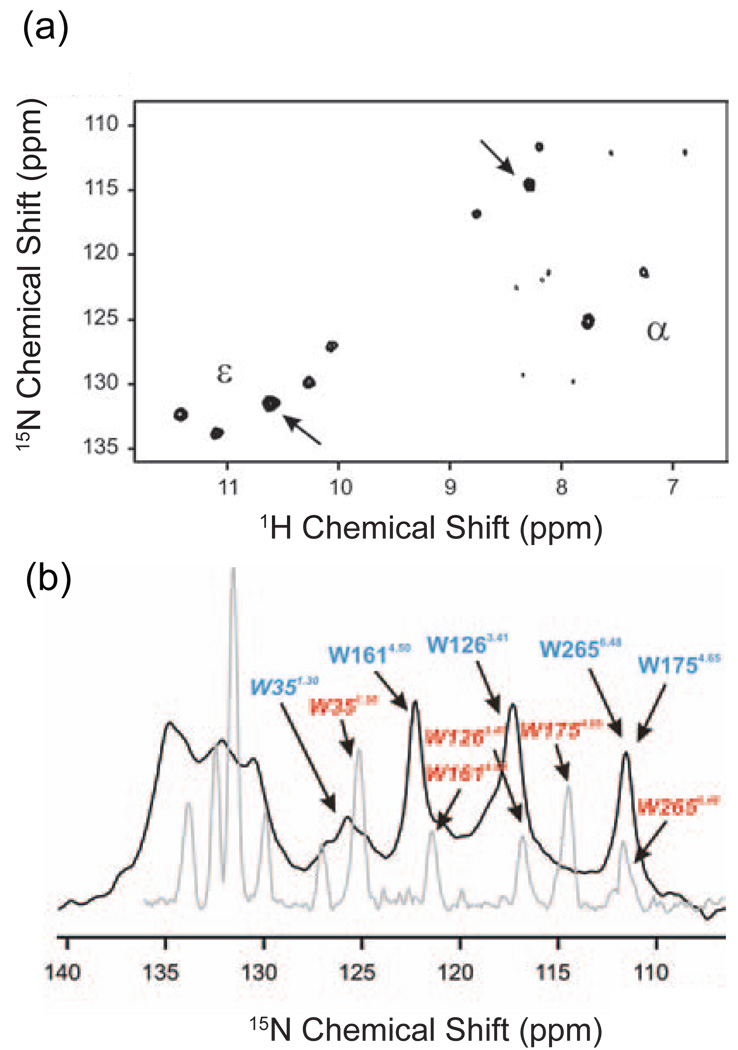
Fig. 2.
Solution NMR spectroscopy of rhodopsin. (a) 1H, 15N HSQC solution NMR spectrum at 900 MHz of 15Nα,ε-tryptophan labeled rhodopsin [141]. The backbone 15Nα and indole 15Nε resonances of the five tryptophans are observed. In addition, weak 15Nα resonances are observed that may correspond to residues on the very flexible C-terminus of the receptor. (b) A single pulse 1D 15N solution NMR spectrum (grey) is overlaid with the corresponding 15N solid-state NMR spectrum obtained using cross polarization and MAS (black). The line widths in the solid-state NMR spectrum are only slightly broader than those obtained by solution NMR methods. The figure is adapted from Ref. [141].

