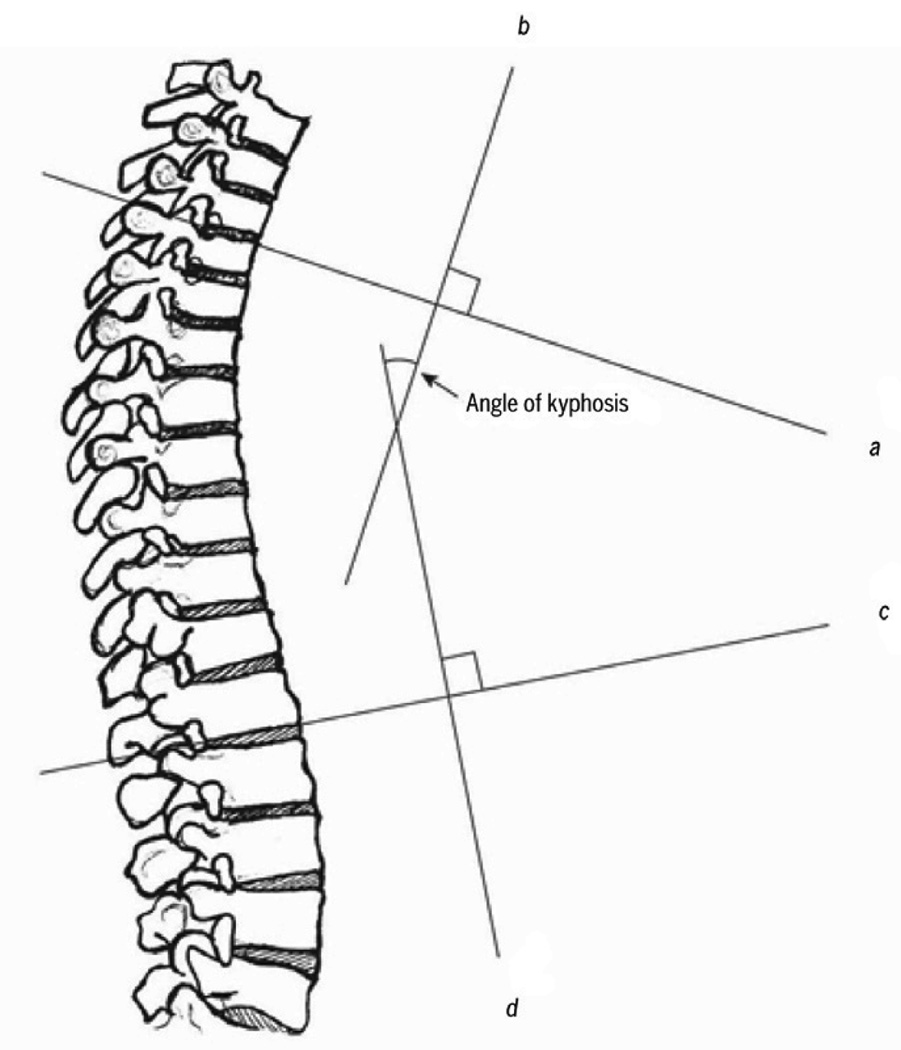
FIGURE 1.
Cobb’s angle of kyphosis, calculated from a lateral radiograph. (A) Draw the first line (line a) through the superior end plate of T3, and a second line (line b) that is perpendicular to line a. (B) Draw a third line (line c) through the inferior endplate of T12, and a fourth line (line d) that is perpendicular to line c. Cobb’s angle of kyphosis is the measured angle at the intersection of lines b and d. Diagram from Kado DM, Prenovost K, Crandall C. Narrative Review: Hyperkyphosis in Older Persons. Ann Int Med. 2007;147:330–338, with permissions from Ann Int Med.33

