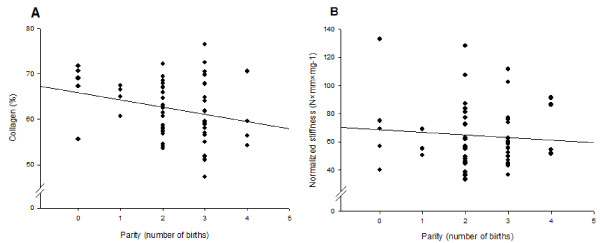
Figure 6.
Parity in relation to collagen concentration and normalized maximum stiffness. Parity in relation (linear regression) to (A) collagen concentration (unadjusted: r = -0.25, p = 0.068, adjusted for age: (r = -0.45, p = 0.033) and (B) normalized maximum stiffness of cervical samples (unadjusted: r = -0.06, p = 0.67, adjusted for age: r = -0.33, p = 0.55).

