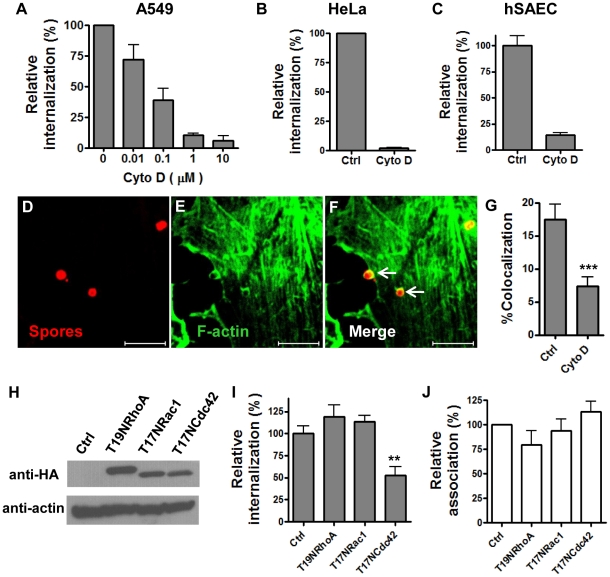
Figure 1. B. anthracis spore internalization by epithelial cells requires actin polymerization mediated by Cdc42.
A – C, the effect of cytochalasin D on spore internalization by A549 (A), HeLa (B) and hSAECs (C). Cells were pretreated with different concentrations (0.01 – 10 µM for A549 cells, 1 and 10 µM for HeLa and hSAECs, respectively) of cytochalasin D (Cyto D) or the solvent control (Ctrl) for 1 hr and then performed fluorescent microscopic examination as described in Materials and Methods. Relative internalization (%) is the ratio of intracellular spores vs. total adhered spores, normalized to the solvent control. The results are the mean ± SEM from at least two independent experiments. D – F, representative images of colocalization of F-actin with spores. A549 cells were incubated with Texas-Red labeled spores and then stained with phalloidin-Alexa Fluor 488. G, colocalization of F-actin with spores is inhibited by Cyto D. Cyto D (10 µM) was included in the colocalization examination as described in Materials and Methods. The percentage of spores with enriched F-actin staining vs. total attached spores is denoted as %Colocalization. The results shown are combined from five independent experiments. ***, p<0.0001, t test. Scale bars represent 5 µm. H – J, Cdc42 is the primary Rho-family GTPase required for spore uptake. A549 cells were transfected with pcDNA3.1(+) vector control (Ctrl), HA-T19NRhoA (T19NRhoA), HA-T17NRac1 (T17NRac1) or HA-T17NCdc42 (T17NCdc42). The expression of the transfected constructs was verified using western blot analysis 24 hr post transfection (H). Dominant negative GTPases were detected by anti-HA antibodies and secondary antibodies as described in Materials and Methods. The actin level was used as a loading control. Spore uptake by (I) and adherence to (J) transfected cells were determined by gentamicin protection assays 24 hr post transfection as described in Materials and Methods. Relative internalization (%) is the ratio of intracellular spores vs. total spores added, normalized to the solvent control. Relative association (%) is the ratio of associated spores (extracellular adhered + intracellular) vs. total spores added, normalized to the solvent control. The results shown are the mean ± SEM, combined from three independent experiments. **, p = 0.0018, t test.

