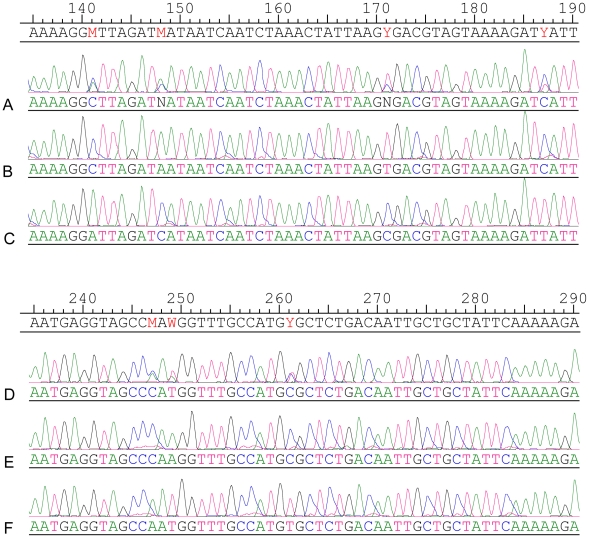
Figure 5. The sequence chromatogram comparison of two multiple infection strains and their PCR clone.
Top alignment, strain no. 37 - A represents partial sequence trace of the PCR product of locus gpsA and B & C represent sequence from clones selected following PCR cloning of this amplicon. Bottom alignment, strain no. 70 - D represents partial sequence trace of the PCR product of locus gpsA and E & F represent sequence from clones selected from PCR cloning of this amplicon.

