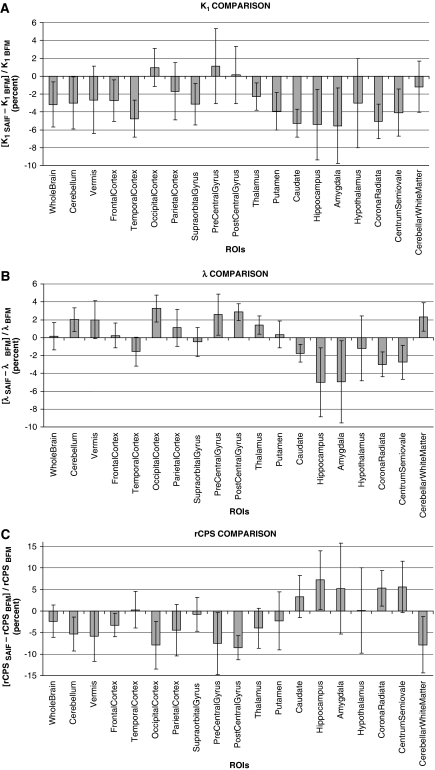
Figure 6.
Percent difference between spectral analysis with iterative filter (SAIF) and voxelwise estimates of K1 (A), λ (B), and regional rates of cerebral protein synthesis (rCPS) (C). For each of the nine subjects, for each region of interest (ROI), and for each parameter, the percent difference was computed as 100*(pSAIF−pvoxelwise)/pvoxelwise, where pSAIF is the SAIF estimate and pvoxelwise is the mean of the voxelwise estimates of the parameter. For each ROI indicated, the bar represents the intersubject mean of the percent difference in the parameter estimates. The intersubject s.d. is indicated by the error bar. In general, there is good agreement between the estimates provided by the two methods. Some of the greatest differences in the estimates between the two methods, as well as the largest intersubject variabilities, are found in the smallest regions (hippocampus, amygdala, hypothalamus, pre- and postcentral gyrus).

