Figure 6.
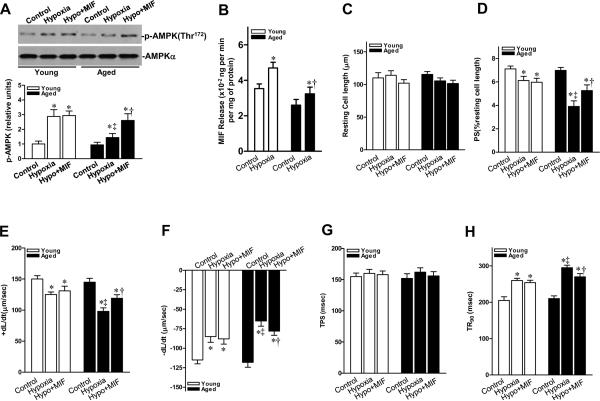
Recombinant MIF restores the contractility of aged cardiomyocytes. A, Immunoblots of p-AMPK of young and aged cardiomyocyte with or without MIF (10 ng/mL) treatment (upper panel). Bars represent the relative levels of p-AMPK (lower panel), n=4 per group, *P<0.05 vs. control, respectively; ‡P=0.03 vs. young hypoxia, †P=0.02 vs. aged hypoxia. B, MIF release from young and aged cardiomyocytes in response to hypoxia treatment, n=4 per group, *P<0.05 vs. control, respectively; †P=0.04 vs. young hypoxia. C, Resting cell length; D, Peak shortening (PS, normalized to cell length); E, Maximal velocity of shortening (+dL/dt) and F, re-lengthening (−dL/dt); G, Time-to-PS (TPS) and H, Time-to-90% relengthening (TR90). For C-H, n = 60–90 cells per group, *P<0.05 vs. control, respectively; ‡P<0.05 vs. young hypoxia, respectively; †P<0.05 vs. aged hypoxia, respectively.

