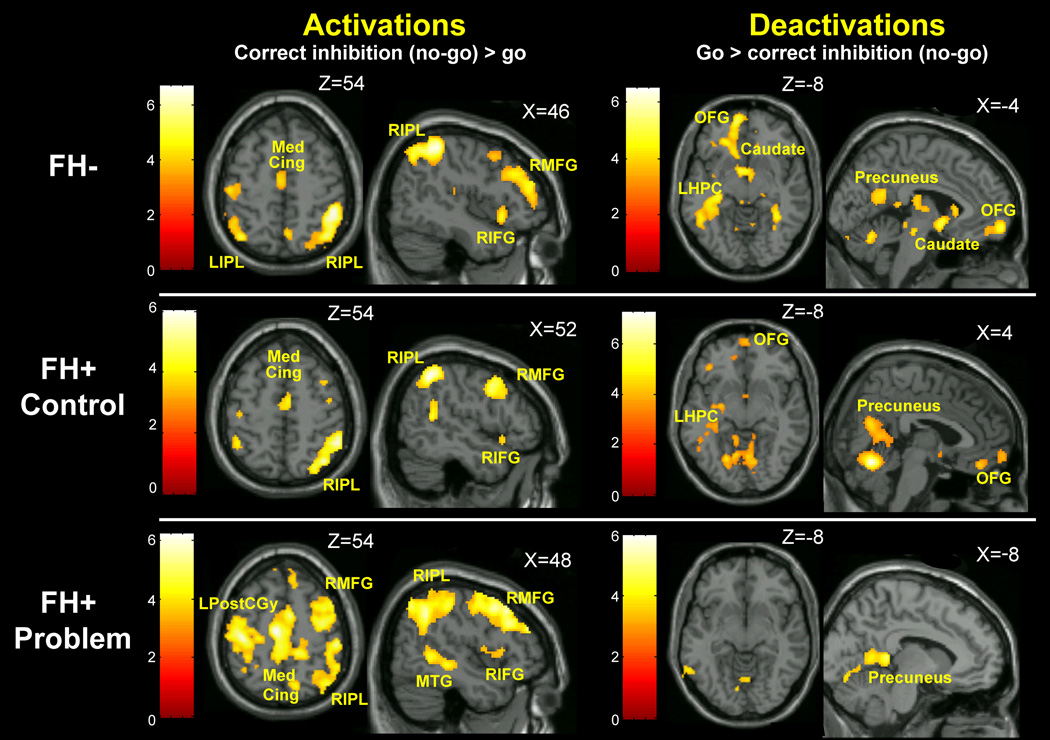
Figure 1.
Activation (no-go>go) and deactivation (go>no-go) for each group displayed at a statistical threshold of p<.005 and minimum cluster size of 10. Each group activated a primarily right hemisphere network including prefrontal, posterior parietal, medial temporal and median cingulate regions. Patterns of deactivation were similar in the FH− and FH+ control groups, including medial prefrontal regions, precuneus/posterior cingulate and left hippocampus. One notable difference in these results, however, was a significant deactivation in brainstem and ventral striatum in the FH− group, which was not present in the FH+ control group. The FH+ problem group showed fewer regions of significant deactivation during response inhibition – the left precuneus, posterior cingulate and left hippocampus. MedCing, median cingulate; LIPL, left inferior parietal lobe; RIPL, right inferior parietal lobe; RMFG, right medial frontal gyrus; RIFG, right inferior frontal gyrus; LPostCGy, left postcentral gyurs; MTG, medial temporal gyrus; OFG, orbitofrontal gyrus, LHPC, left hippocampus. Color bars represent t-scores.

