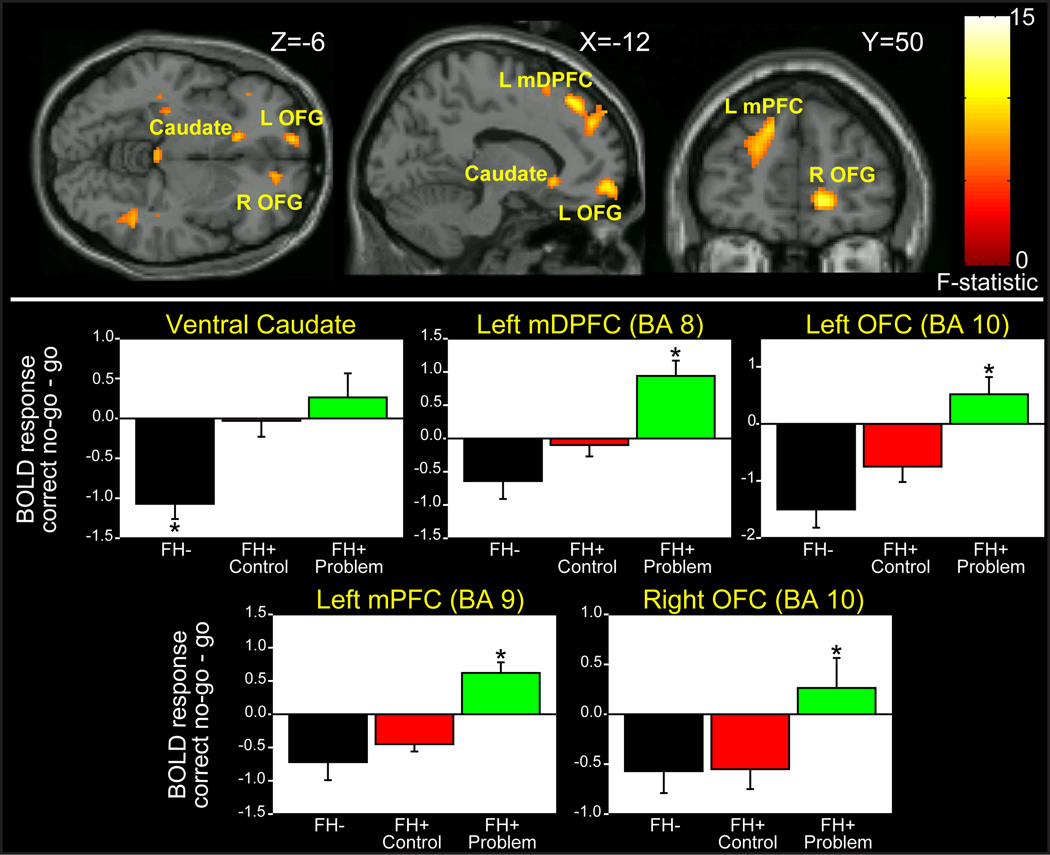
Figure 2.
Top: SPM ANOVA results. Bottom: Regions from SPM analysis plotted for FH−, FH+ control and FH+ problem groups. Tukey’s post-hoc tests showed that ventral caudate activation differed between FH− and FH+ control (p=.015) and FH+ problem (p=.001), whereas it did not differ between the two FH+ groups (p>.6). Left and right OFG, mPFC and mDPFC differed between FH+ problem and FH+ control (p≤.01) and FH− (p<.01), but not between FH− and FH+ control (all p>.2). L, left; R, right; OFG, orbitofrontal gyrus, mPFC, medial prefrontal cortex; mDPFC medial dorsal prefrontal cortex; * significant difference from both other groups p<.05.

