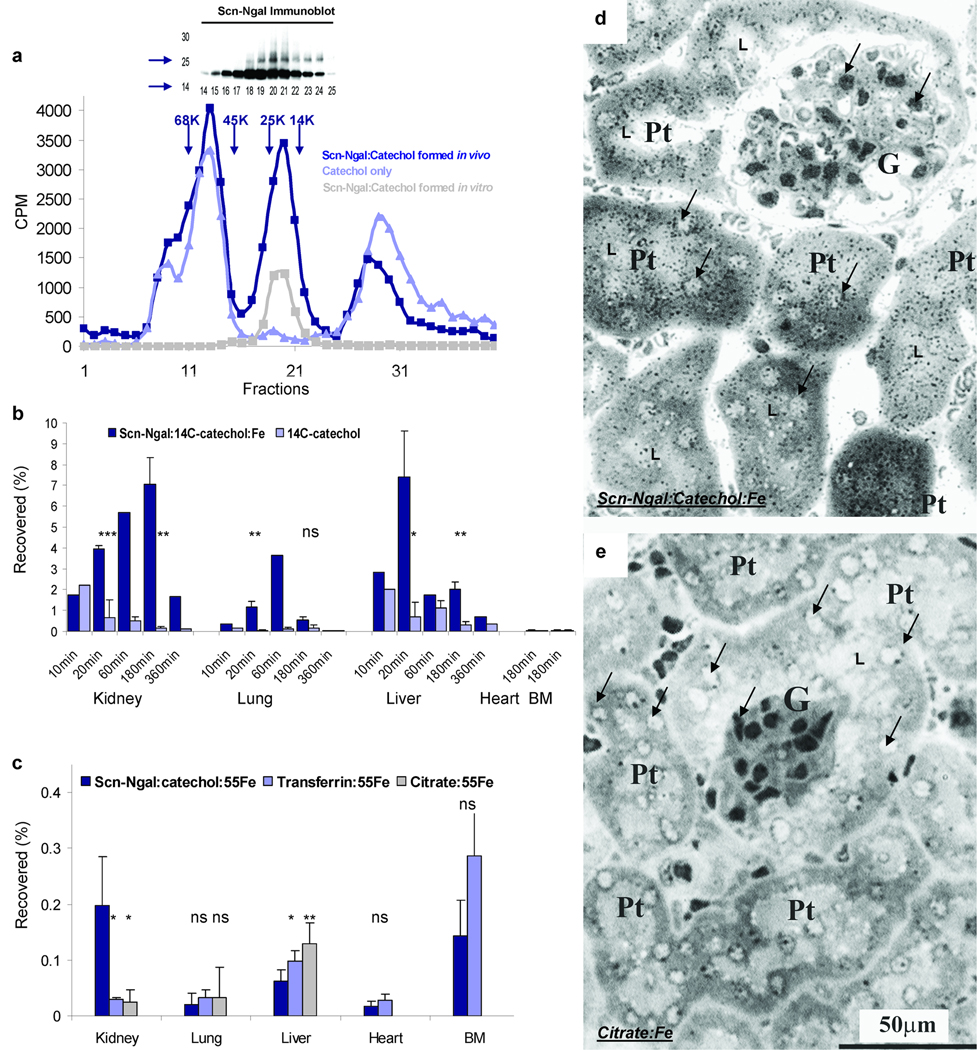
Figure 4.
The formation and distribution of the Scn-Ngal:catechol:Fe complex in vivo. (a) The Scn-Ngal:catechol complex can form in serum and be detected five minutes after i.p. injection of each component. The complex was identified by gel filtration of serum followed by immunoblots and scintillation counting (dark blue line), which revealed Ngal:14C-catechol:Fe centered at fraction 20 (n = 3 independent fractionations). Also shown is the authentic Scn-Ngal:14C-catechol:Fe complex formed in vitro (grey line) and serum taken after the injection of free 14C-catechol (light blue line). (b) The distribution of the Scn-Ngal:14C-catechol:Fe complex vs free 14C-catechol was reported as a percentage of the injected 14C-catechol (n = 4 independent experiments; data represent mean ± s.d.). At 20 and 180 min, ns signifies non-significant differences, *P < 0.05; **P < 0.005; ***P < 10−4 as assessed by two tailed Students t-test. (c) The complexes, Scn-Ngal:catechol:55Fe, citrate:55Fe, and transferrin:55Fe were recovered at 3 hrs. Whereas Scn-Ngal:catechol:55Fe located predominately to the kidney, citrate:55Fe and transferrin:55Fe located predominantly to the liver or bone marrow (n = 5–7 independent experiments, data represent mean ± s.d., *P < 0.05; **P < 0.005). (d, e) Trafficking of 55Fe to the kidney was visualized by radioautography using Ilford K5D emulsion. Note the black silver grains in proximal tubules (Pt) after introduction of (d) Scn-Ngal:catechol:55Fe but not after the introduction of (e) citrate:55Fe. Glomeruli (G), proximal tubules (Pt), examples of nuclei (arrows) and tubular lumen (L) are indicated (n = 2 independent experiments).

