
Figure 6.
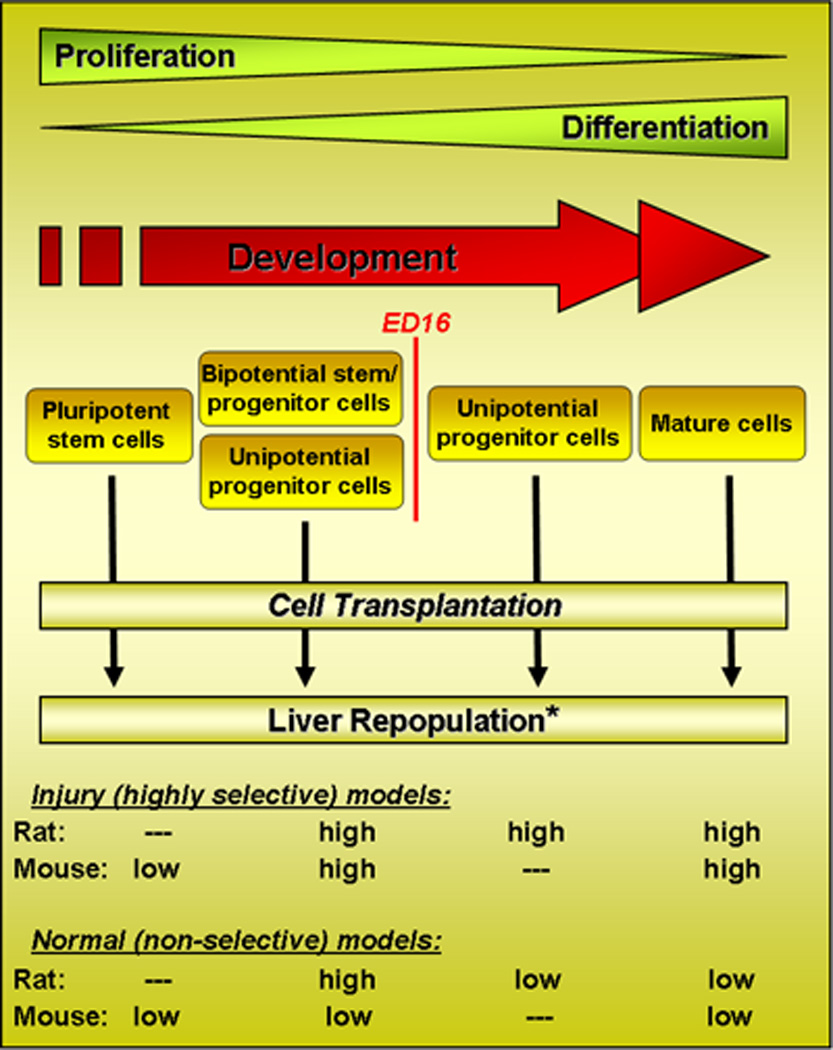
Schematic diagram illustrating the relationship of fetal liver hepatic lineage progression to the repopulation potential of isolated hepatic cells under non-selective vs. highly selective repopulation conditions.
Official websites use .gov
A
.gov website belongs to an official
government organization in the United States.
Secure .gov websites use HTTPS
A lock (
) or https:// means you've safely
connected to the .gov website. Share sensitive
information only on official, secure websites.
Schematic diagram illustrating the relationship of fetal liver hepatic lineage progression to the repopulation potential of isolated hepatic cells under non-selective vs. highly selective repopulation conditions.