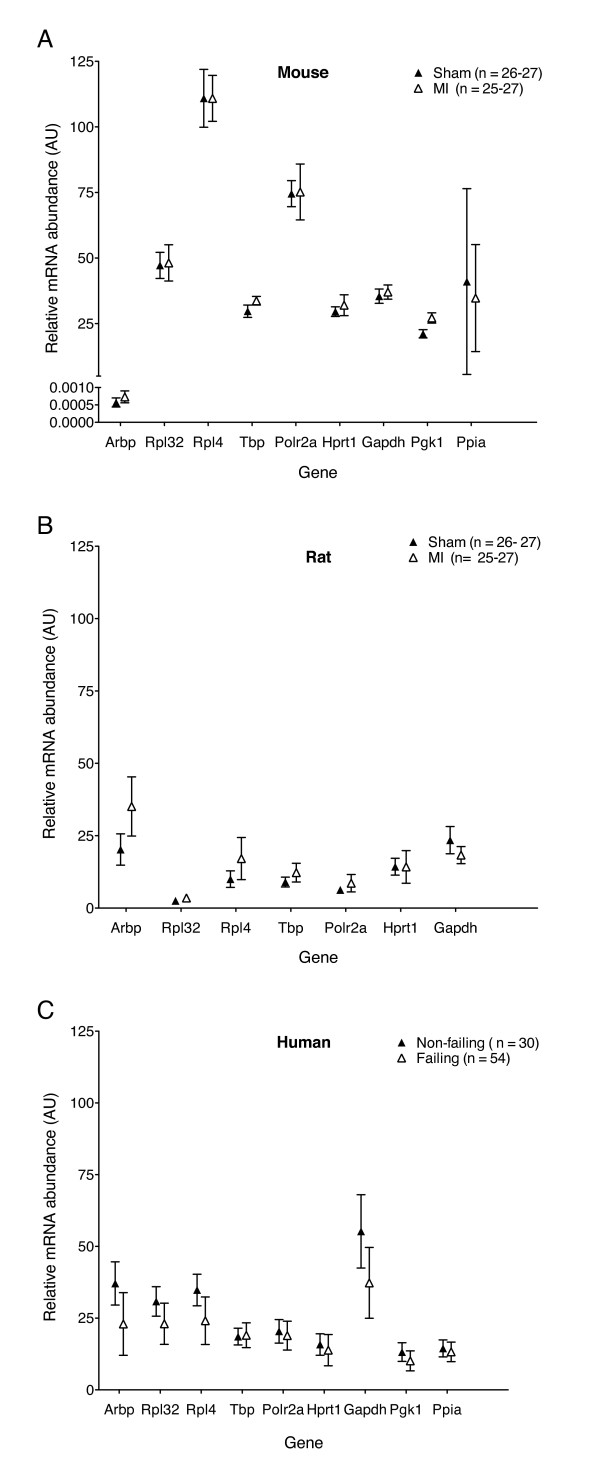
Figure 1.
Variation in candidate reference gene abundance in mouse, rat and human myocardium. The indicated species-specific assays were run and Cq values converted to relative mRNA quantities (arbitrary units) using standard curves generated from species-specific pooled samples. To illustrate the total variability in the datasets for each species, the plotted data points (mean ± SD) includes all PCR runs generated from all biological samples and RT repetitions within the sham/MI or donor/failing groups for each gene. For mouse and rat groups, n = maximum of 27 PCR reactions within each group for all tested genes. For human genes, n = 30 PCR reactions were included in the donor group and 54 PCR reactions in the failing group for each gene, respectively. (A) mouse Sham and post-MI samples; (B) rat Sham and post-MI samples and (C) human non-failing (donor) and failing heart samples.

