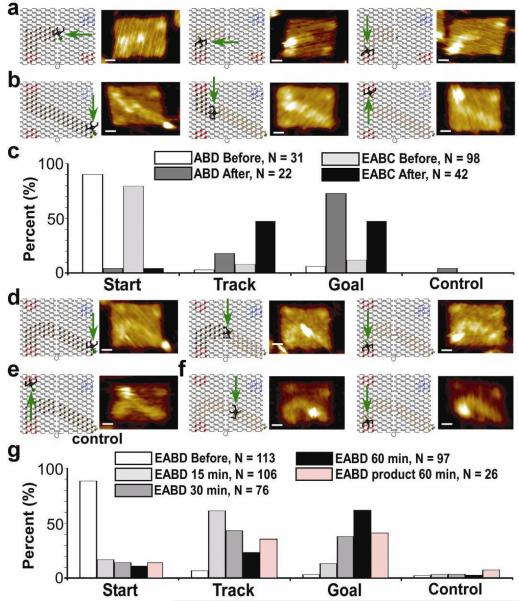
Figure 2. Results of spider movement along three tracks with schematics and AFM images of the spider at the start, on the track, and at the stop site.
a, ABD track. b, EABC track. c, Graph of ABD and EABC spider statistics before and 30 minutes after release. d, EABD track. e, EABD track with spider on control. f, EABD product-only track. g, Graph of the EABD spider statistics before, and 15, 30 and 60 min after release, and 60 min after release on the EABD product-only track. All AFM images are 144 x 99.7 nm, the scale bar is 20 nm. Legend text indicates the number of origami with a single spider that were counted for the given sample.

