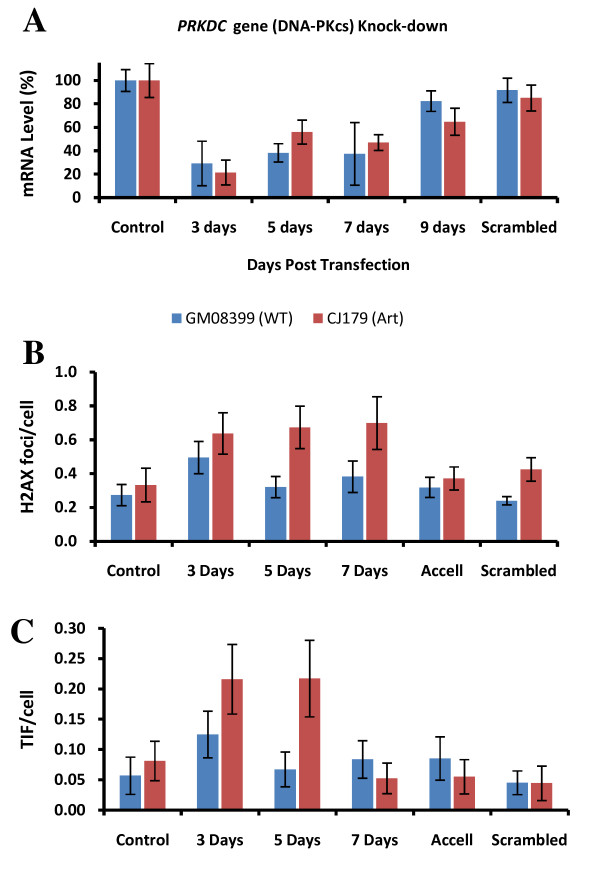
Figure 7.
PRKDC knock-down by RNAi. A. Analysis of DNA-PKcs expression by real time PCR after transfection with siRNA oligonucleotides specific for PRKDC. The results were normalized against endogenous GAPDH mRNA expression and are based on two independent experiments. Non-targeting (scrambled) siRNA sequence was used as negative control. Error bars indicate SD. B. Frequenceis of γ-H2AX foci before and after transfection. The data are based on two independent experiments with an average of 100 nuclei scored per point. The error bars represent SEM. C. Frequencies of TIFs before and after transfection. The data are based on two independent experiments. Error bars represent SEM. The difference in TIF between the two lines is significant at 5 days post transfection (p < 0.012).

