Figure 2.
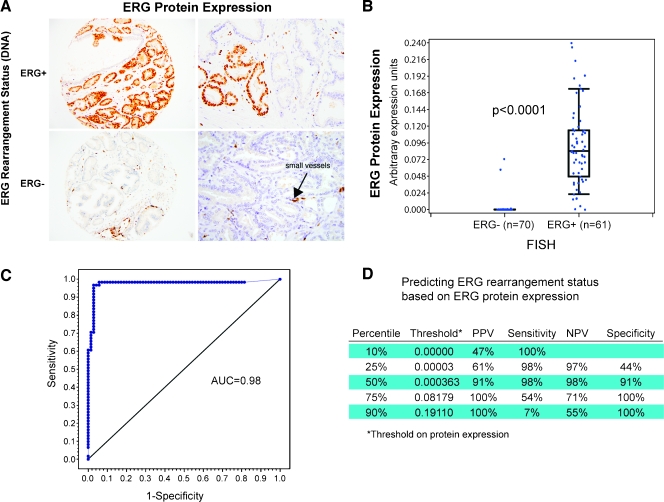
ERG rearrangement by break-apart FISH is highly correlated with ERG protein expression by IHC. (A) ERG protein expression in tumors with and without the TMPRSS2-ERG gene fusion. The endothelial cells of small vessels show positive endogenous ERG expression in the context of surrounding ERG-negative cancer glands (left 20x, right 40x). (B) The box plot demonstrates a highly significant association between the automated image evaluation of ERG protein expression and the ERG gene rearrangement status for 128 cases (P < .0001, Wilcoxon rank-sum test). Of 70 ERG rearrangement-negative cases, 2 demonstrate ERG protein expression. (C) Using a threshold of 0.4 as the cut point for determining ERG status, we observed excellent ROC curve performance with an AUC of 0.98 using ERG rearrangement by FISH as the criterion standard. (D) A summary of the performance of ERG protein expression to predict ERG rearrangement status is presented for different thresholds.

