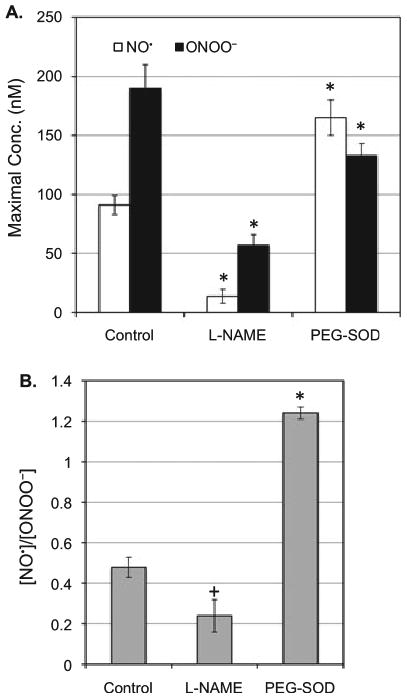
Figure 2.

NO˙ and ONOO− release from the cells irradiated with UVB (0.5 mW cm−2) for 1 min in the presence or absence of l-NAME (2 μm) or PEG-SOD (100 U). (A) Maximal [NO˙] and [ONOO−] produced by a keratinocyte after UVB treatment. (B) A ratio of maximal [NO˙]/[ONOO−] produced by a keratinocyte after UVB treatment. The data represent the average of three sets of independent measurements. *P < 0.001 vs control; + P < 0.1 vs control.
