
Figure 8.
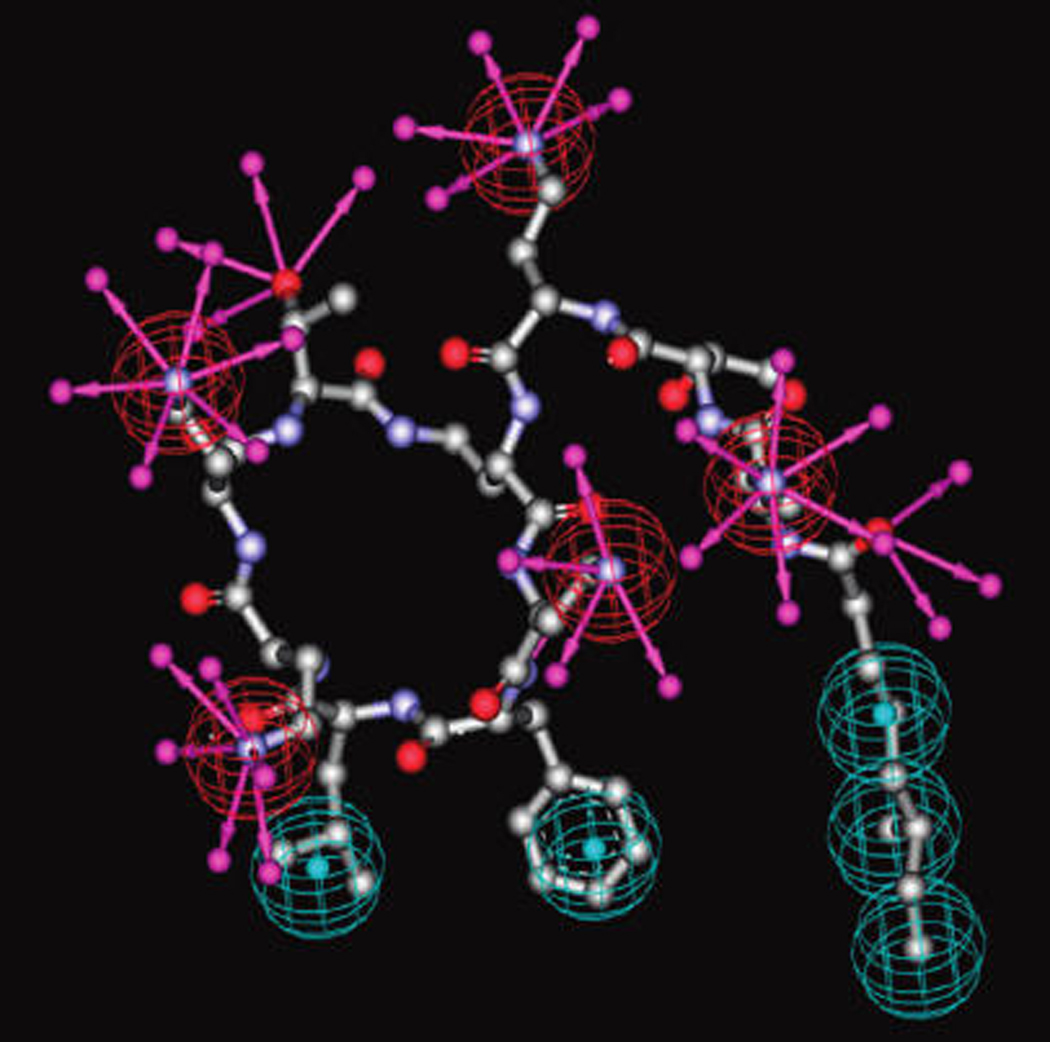
Polymyxin B pharmacophore model. Red location spheres indicate positive charge property. Hydrophobic property is represented by cyan location spheres. Hydrogen bond donor vectors are shown in purple. The polymyxin backbone is shown in ball and stick representation.