
Figure 2.
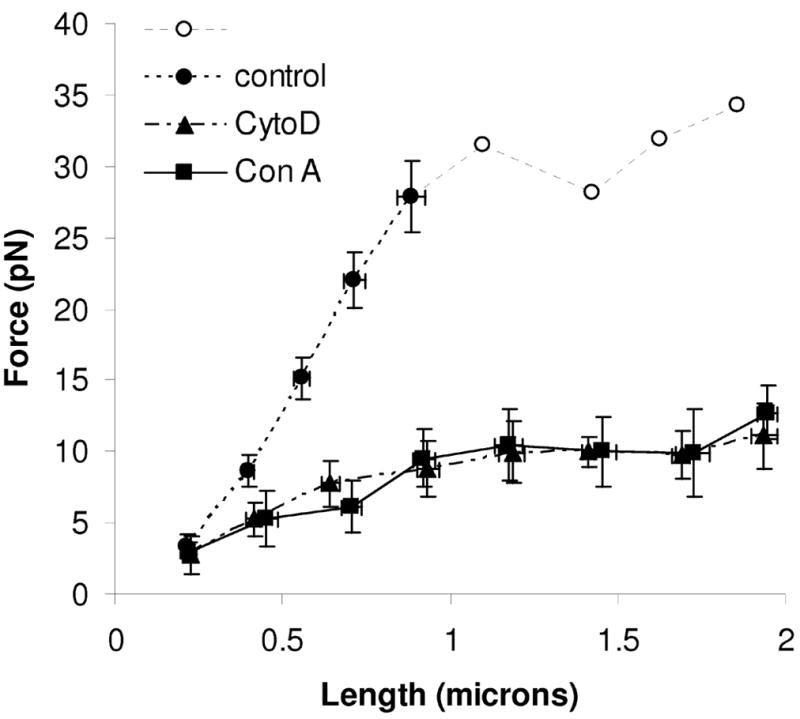
Quasi-steady state force versus microvillus length for control (KPL-1/PSGL-1, ●○), cytochalasin D treated (▲) and microvilli pulled via conanavalin A (■). Each data marker represents the mean of all similarly sized steps for that condition. Error bars represent s.e.m. Microvillus elongations that yield forces above 30 pN are shown as open symbols (○) and without error bars because trap properties become non-linear (see text); those values should be treated as approximate.