Abstract
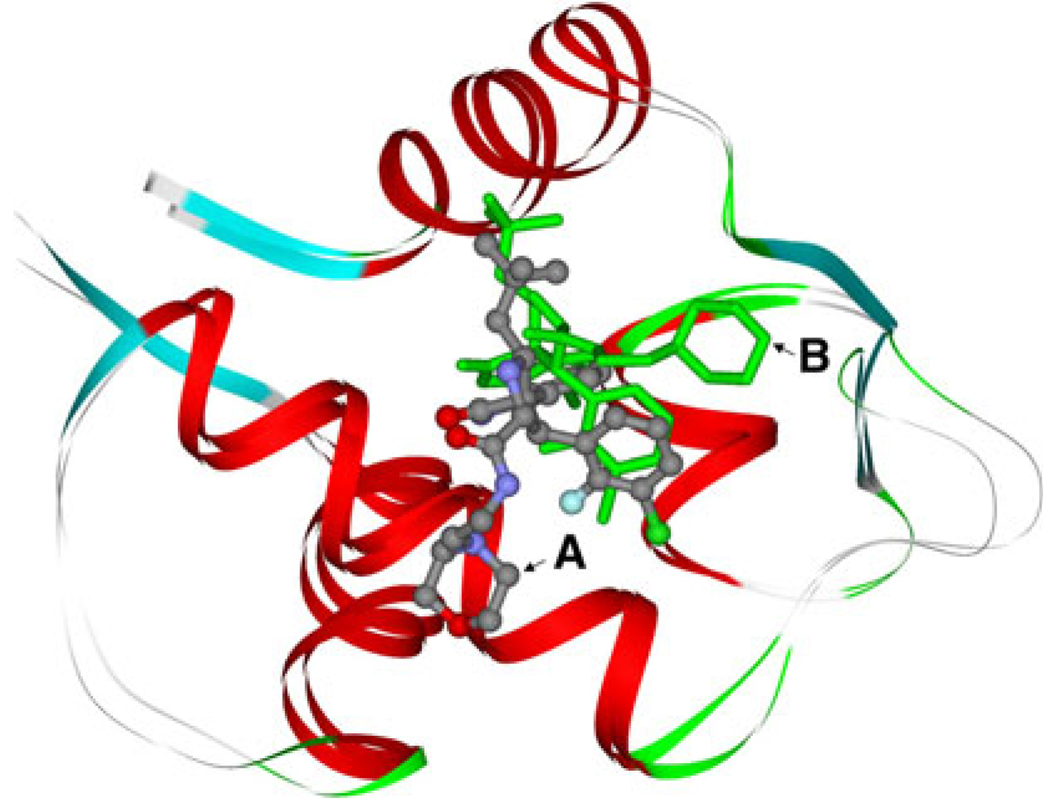
It is a new and promising strategy for anti-cancer drug design to block the MDM2-p53 interaction using a non-peptide small-molecule inhibitor. We carry out molecular dynamics simulations to study the binding of a set of six non-peptide small-molecule inhibitors with the MDM2. The relative binding free energies calculated using molecular mechanics Poisson–Boltzmann surface area method produce a good correlation with experimentally determined results. The study shows that the van der Waals energies are the largest component of the binding free energy for each complex, which indicates that the affinities of these inhibitors for MDM2 are dominated by shape complementarity. The A-ligands and the B-ligands are the same except for the conformation of 2,2-dimethylbutane group. The quantum mechanics and the binding free energies calculation also show the B-ligands are the more possible conformation of ligands. Detailed binding free energies between inhibitors and individual protein residues are calculated to provide insights into the inhibitor-protein binding model through interpretation of the structural and energetic results from the simulations. The study shows that G1, G2 and G3 group mimic the Phe19, Trp23 and Leu26 residues in p53 and their interactions with MDM2, but the binding model of G4 group differs from the original design strategy to mimic Leu22 residue in p53.
Keywords: MDM2, Molecular dynamics simulation, Binding model, MM-PBSA
Introduction
The tumor suppressor p53 is an important protein in regulating cell cycle arrest, apopotosis, and DNA repair [1–3]. In reality, over half of all human cancers function has been nullified by mutations or deletions in the DNA-binding domain of p53 [4]. In some the remaining of human cancer cases, the activity of wild-type p53 is inhibited by the MDM2 oncoprotein interacting directly with p53. The complications in functioning of p53 and MDM2 cover a range of tissue types, including connective tissue [5], brain, esophagus, and breast [6]. It is believed that suppression of MDM2 activity could enhance the growth-suppressing effects of p53. Reactivation of the p53 function by disruption of the MDM2-p53 interaction using a non-peptide small-molecule inhibitor is now recognized as a new and promising strategy for anticancer drug design [7–12].
The MDM2-p53 interaction has been well characterized at a molecular level [13–16]. X-Ray structures show that the p53 peptide adopts a helical structure in MDM2-p53 complex [17]. The interaction between p53 and MDM2 is mainly mediated by three hydrophobic residues Phe19, Trp23, and Leu26 of p53 and a small but deep hydrophobic cleft in MDM2. Recently, many works have been interested in designing small-molecule MDM2 inhibitors to block the MDM2-p53 interaction based on this hydrophobic cleft of MDM2 [9, 18, 19]. The non-peptide inhibitors mimic the side chains of Phe19, Trp23, and Leu26, and have higher binding affinities than natural p53 peptide (residues 16–27) [18].
X-Ray crystallography reveals that in addition to the Phe19, Trp23, and Leu26 residues in p53, a fourth residue, Leu22, also appears to play an important role in the overall interaction between p53 and MDM2, a suggestion that finds support in results from mutation analysis [20, 21] and alanine scanning of p53 peptides [13]. A quantum mechanical calculation on the p53 and MDM2 binding also supports that the residue Leu22 plays an important role in the interaction of p53 with MDM2 [22].
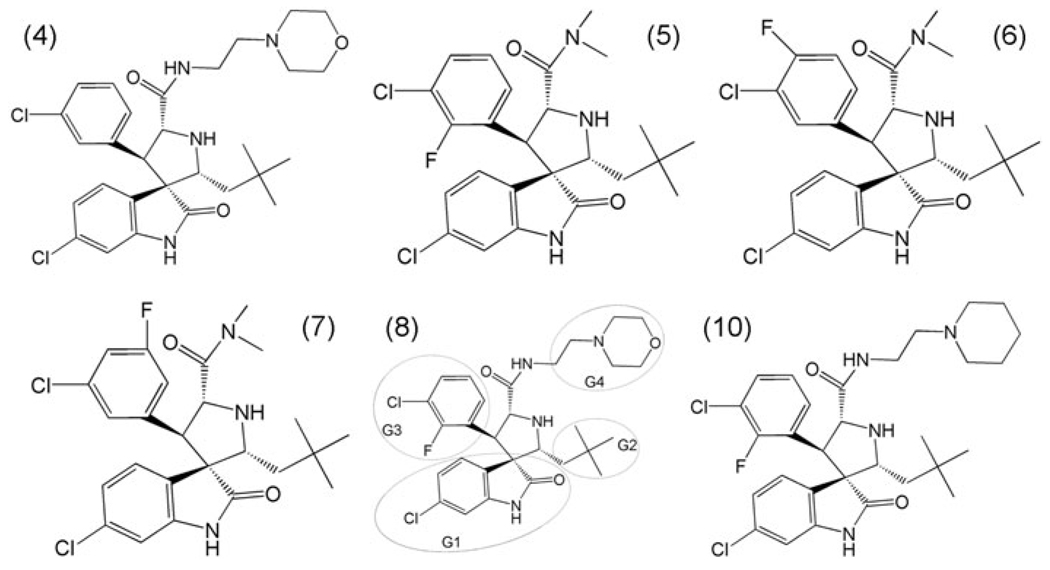
Ding et al. [18] have successfully designed a class of high affinity, specific, cell-permeable, non-peptide small-molecule inhibitors of the MDM2-p53 interaction using structure-based design strategy. The structures of the six inhibitors are shown in Fig. 1. The names of inhibitors are the same as used in Ding’s paper. The binding model between the inhibitor 8 and MDM2 was predicted by the GOLD program. The most potent inhibitor 8 contains a 2-morpholin-4yl-ethylamine (G4) group which has been believed not only to mimic Leu22 for its interaction with MDM2 but also to capture the interaction between Glu17 in p53 and Lys94 in MDM2. The special role of G4 is dominantly different from the former non-peptide inhibitors [8, 9]. Understanding the protein–ligand interaction at the atomic level of this group of compounds may lead to the development of MDM2 inhibitors with better potency. However, a detailed mechanism of both energies and structure is still unknown. We are interested in the binding model predicted by Ding.
Fig. 1.
Molecular structures of six inhibitors. In inhibitor 8, (G1) for 6-chloro-2-oxo-indole group, (G2) for 3-chloro-2-fluoro-phenyl group, (G3) for 2,2-dimethylbutane group and and G4 for 2-morpholin-4yl-ethylamine group
Molecular dynamics (MD) simulation could serve as a powerful tool for understanding the binding mechanisms of the protein-inhibitors complex. Several computational methods exist to estimate ligand binding affinities, with various levels of computational expense and accuracy: [23] thermodynamic integration (TI), linear response (LR), free energy perturbation (FEP) [24–26], and molecular mechanics Poisson–Boltzmann surface area (MM-PBSA) [27, 28]. The MM-PBSA method is a versatile tool for calculating the binding free energies of a given protein–ligand complex, which incorporates the effects of thermal averaging with a force field/continuum solvent model to post-process a series of representative snapshots from molecular dynamics(MD) trajectories. The MM-PBSA method has been successfully applied to protein–ligand interaction, DNA-drug interaction, and RNA-protein interactions [29–34].
It is difficult to account for the solvation/desolvation effects on and entropic contributions to the binding free energy as well as the effects on protein dynamics on the microscopic binding during molecular docking process [27]. The currently used docking scoring functions are not expected to consistently provide accurate predictions of the protein–ligand binding free energies for all of the protein–ligand binding systems [35]. It is demonstrated that the combined computational protocol is reliable and accurate for predicting protein–ligand binding structures and binding free energies, whereas only performing simple molecular docking could lead to a wrong binding mode and thus mislead the drug design [35]. In order to examine the binding model between MDM2 and inhibitors which is described in Ding’s work, we use molecular docking, MD simulation-based MM-PBSA free energy calculations to analyze interactions between MDM2 and a group of inhibitors. In additional, the decomposition of free energy on per-residue and the structural analysis is performed to give insights on the binding model.
Theory and method
System setups
In order to obtain the structures of these inhibitors, the Chemoffice software is used to construct the original structures. Then the original structures are energy-minimized using the Gaussian software [36] at the HF/6–31G level. To explore the intrinsic stability of inhibitors, the energies of inhibitors are calculated using quantum chemistry theory at the HF/6–31G and B3LYP/6–311++G(d,p) levels, respectively. Owing to the lack of parameters needed for the ligand in the Cornell et al. force field [37], the missing parameters are developed. Optimization of the ligand is first carried out at the HF/6–31G** level with the Gaussian 03 package [36]. The Restrained Electrostatic Potential (RESP) procedure [38], which is also part of the AMBER package, is used to calculate the partial atomic charges. GAFF [39] force field parameters and RESP partial charges are assigned using the ANTECHAMBER module in the AMBER 9 package. The standard AMBER force field for bio-organic systems (FF03) [40] is used to describe the protein parameters. To neutralize the charge of systems, an appropriate number of chloride counterions are placed to grids with the largest positive Coulombic potentials around the complexes. All solutes are surrounded by a truncated octahedron periodic box of water molecules described by the TIP3P [41] potential extended to a distance of 10 Å from solute atoms.
Molecular docking
No crystallographic structure of MDM2 complex with inhibitors is currently available. Inhibitor 8 is docked to the active site of MDM2 with autodock4.0 [42, 43] by using the genetic search algorithm. The MDM2 structural coordinates are extracted from the crystal structure of MDM2 complexed with a p53 transactivation domain peptide available from the Protein Data Bank (PDB code: 1YCR). The numbers of grid points in xyz are set to 60, 60, 60 with the spacing value equivalent to 0.375 Å, and the center of the Tyr23 of the p53 peptide regarded as the grid center. During docking, the number of individuals in population, maximum number of energy evaluation, maximum number of generations and GA-LS runs are rectified to 150, 3,000,000, 2,700,000 and 200, respectively. Other parameters set as the default values implemented by the program.
Molecular dynamics simulation
Twelve simulations are carried out using the AMBER 9 [44] package with the Cornell et al. all-atom force field and parameters are developed in this work. The particle mesh Ewald (PME) method [45] is employed to treat long-range electrostatic interactions, and bond lengths involving hydrogen atoms are constrained using SHAKE algorithm [46]. The time-step for three MD simulations is 2 fs, with a direct-space, non-bonded cutoff of 12 Å.
The 12 systems are minimized with the module SANDER in constant volume by 1,000 cycles of steepest descent minimization followed by 1,000 cycles of conjugated gradient minimization. These procedures ensured that the initial structure is maintained while the solvent is allowed to relax. After energy minimization, applying harmonic restraints with force constants of 2 kcal/(mol Å2) to all solute atoms, canonical ensemble (NVT)-MD is carried out for 70 ps, during which the systems are heated from 0 to 300 K. Subsequent isothermal isobaric ensemble (NPT)-MD is used for 90 ps to adjust the solvent density. Finally, 3 ns isothermal isobaric ensemble (NPT)-MD simulation is applied to both simulations without any restraints. The temperature is regulated at 300 K using Langevin thermostat and the pressure is kept at 1.0 atm using isotropic positional scaling. Trajectories are analyzed at every 1 ps using PTRAJ module.
MM-PBSA calculations
In this work, MM-PBSA method is used to calculate the relative binding free energy of inhibitor to MDM2. The details of this method have been presented elsewhere [27]. Briefly, The MM-PBSA method can be conceptually summarized as
| (1) |
The binding free energy (ΔGbind) is evaluated a sum of the changes in the molecular mechanical (MM) gas-phase binding energy (ΔGMM), the solvation free energy (ΔGsolv), and entropic(–TΔS) contribution
| (2) |
ΔGMM is further divided into a van der Waals (ΔEvdW) and electrostatic energies (ΔEele). These energies are computed using the same parameters set as that used in the MD simulation.
| (3) |
| (4) |
And the solvation free energy (ΔGsolv) is further divided into a polar (ΔGpol) and a nonpolar component (ΔGnonpol). The polar free energy (Gsolv) is calculated with a PBSA module of the AMBER suite. The dielectric constant is set to 1 inside the solute and 80 in solvent in our calculation. The nonpolar free energy (ΔGpol) is determined by Eq. 5, where SASA is the solvent-accessible surface area that is determined with MSMS program [47], with a probe radius of 1.4 Å. The values γ and β are the empirical constants. We also used 0.00542 kcal/(mol Å2 ) and 0.92 kcal/mol, respectively [48]. We choose a total number of 100 snapshots evenly from the last 1 ns on the MD trajectory with an interval of 10 ps.
| (5) |
Finally, we estimate the conformational entropy contributions to the binding free energy using normal-mode analysis with AMBER NMODE module [49]. Due to extremely time-consuming of entropic calculation for large system, only 25 snapshots (every fourth snapshot of the 100 snapshots) for each system are used to estimate the contribution of the entropies to lower the computational time.
The experimental binding energies are calculated from published inhibition constants Ki by Eq. 6,
| (6) |
where inhibition constants are obtained from Ding’s work [18].
Results and discussion
The structures of the inhibitors
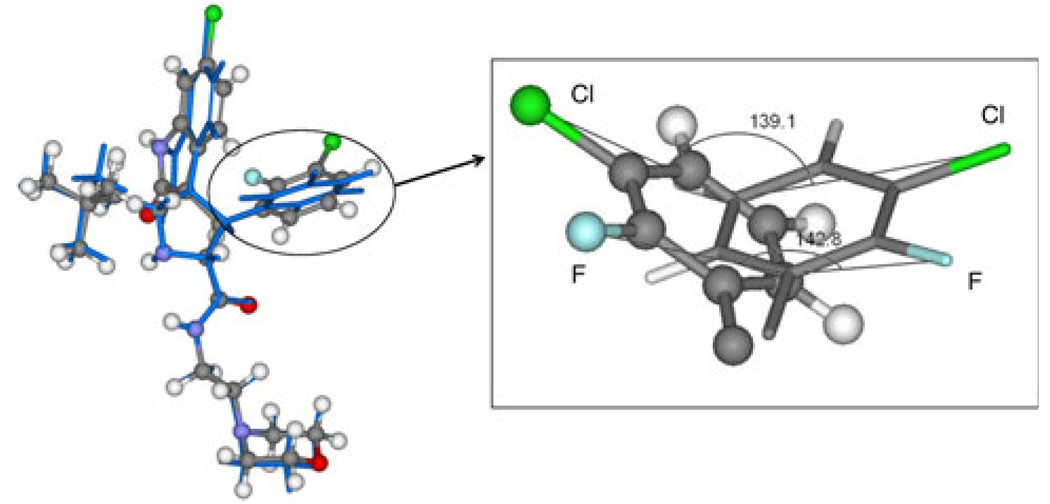
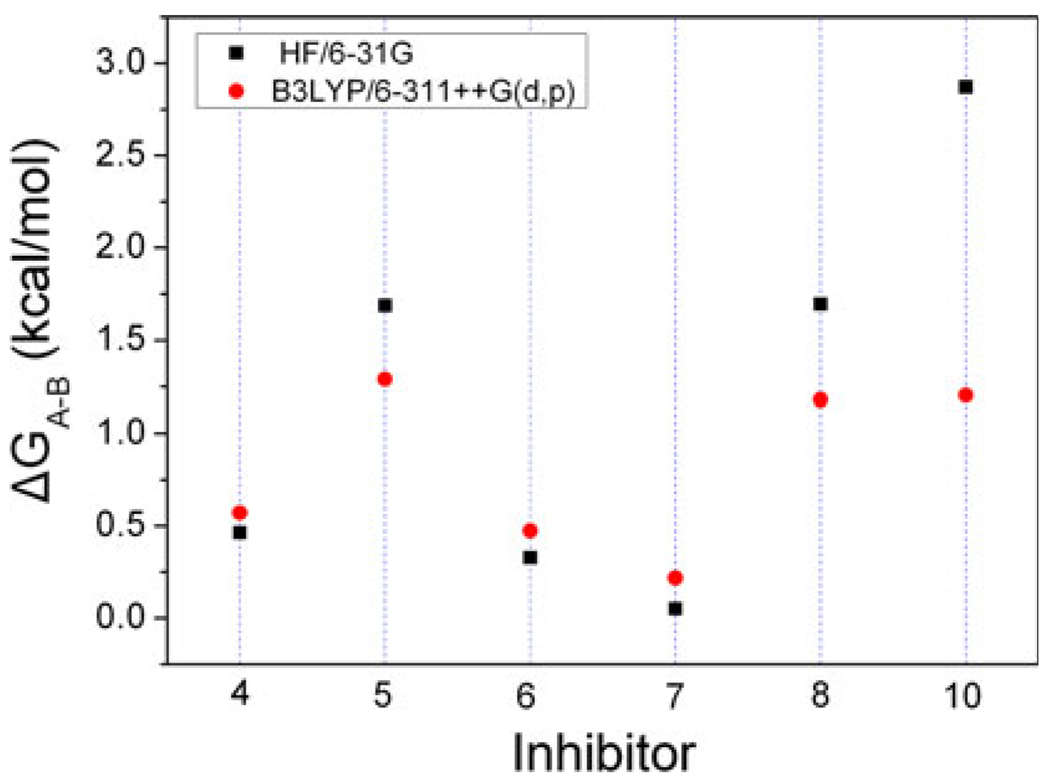
The structures of the inhibitors are designed, and the structures are energy-minimized. The results show that there are two optional conformations. One conformation is corresponding to the structures used in Ding’s work (A), the other one (B) is different. The two conformations of inhibitor 8 are shown in Fig. 2. In the two conformations, the G1, G2 and G3 groups coincide with each other very well, while the G4 group has apparent difference. To show the differences, two angles are labeled in Fig. 2, one is formed by a chlorine atom of conformation A with a carbon and a chlorine atoms of conformation B, the other one is formed by a fluorine atom of conformation B with a carbon and a fluorine atoms of conformation A, the degrees of them are 139.1° and 142.8°, respectively. The G3 group of A-ligand rotates about 140.0° relative to B-ligands. The similar results are also obtained on other five inhibitors, for all the ligands have the same chemical scaffold. The intrinsic relative stability of these inhibitors is explored using quantum chemistry theory at the HF/6–31G and B3LYP/6–311++G(d,p) levels. In order to show the differences between the two conformations, we calculate the differences of energy (ΔGA–B) between A-ligands and B-ligands according to the following equation: ΔGA–B = GA – GB, and the results are shown in Fig. 3. The calculated results with all the positive values in both level show that all the A-ligands are little higher in energy than B-ligands. This can be well ascribed to the steric effect between the 3-chloro-2-fluoro-phenyl group and 2,2-dimethylbutane group in the B-ligands. The chlorine and the fluorine atoms in B-ligands increase the intramolecular interactions. All these results indicate that B-ligands are thermodynamically more stable than A-ligands. The rationality of conformations B is also confirmed by the interaction energies between MDM2 and the two group inhibitors.
Fig. 2.
Left picture is the conformation A overlapped with conformation B of inhibitor 8. The conformation A is shown in stick and ball represents with different color of element, the conformation B is shown in stick represents with blue. The right one is the enlargement for the G3 group. All the atoms is labeled by different color of element. Two angles are labeled
Fig. 3.
The differences of energies (ΔGA–B) between A-ligands and B-ligands calculated by quantum chemistry theory
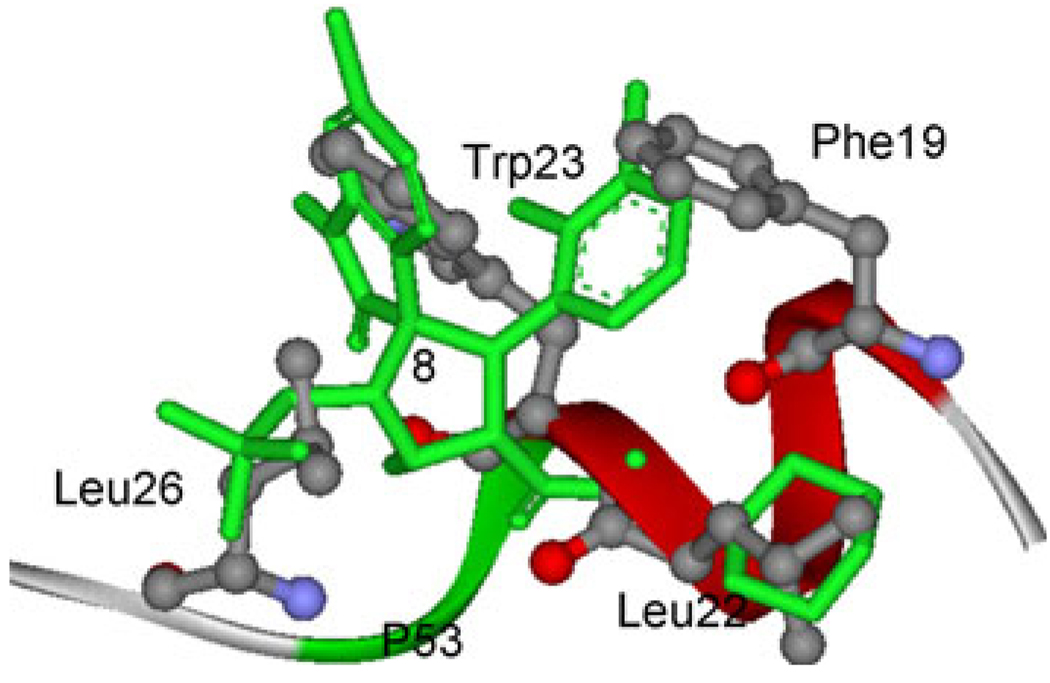
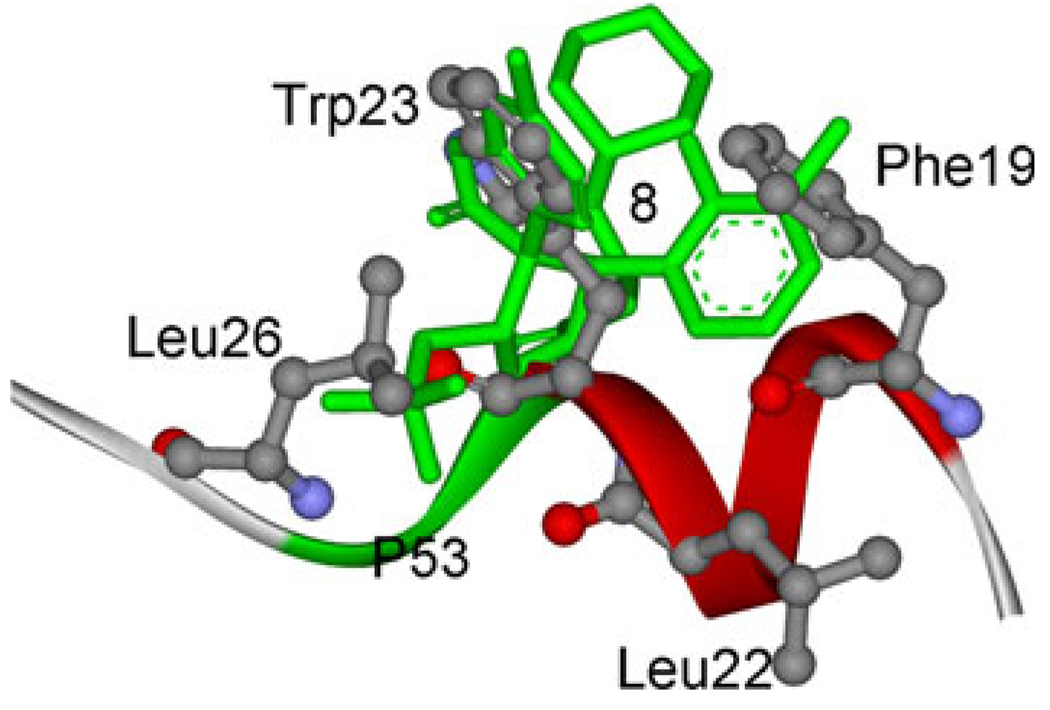
The inhibitors are designed to mimic the binding model of p53 with MDM2 by Ding et.al. After docking, in order to keep consistent with Ding’s work, the initial structure of inhibitor 8 of B-ligands is chosen based on the dock energy, cluster popularity and the dock result of Ding [18] for further molecular simulation studies. As shown in Fig. 4, the G1, G2, G3 and G4 groups of initial structure of MD simulation can overlap well with the residues Trp23, Leu26, Phe19 and Leu22, respectively. The result is consistent with Ding’s work. The information suggests our design strategy of the starting structure of MDM2 with inhibitors is correct. As shown in Fig. 1, all the inhibitors have the same chemical scaffold. So the starting structures of MDM2 complex with other inhibitors of B-ligands are obtained by direct modification of the MDM2/8 complex. This method is proved to be useful in studying the binding model of inhibitors with the same chemical scaffold [50]. The starting structures of complexes of MDM2 and A-ligands are obtained by direct modification of the corresponding B-ligands.
Fig. 4.
Superposition of compound 8 to the p53 peptide conformation in the crystal structure of p53 peptide conformation in complex with MDM2. Four residues, Phe19, Leu22, Try23, and Leu26 in ball and stick representation. The compound 8 is colored in green with stick representation
Equilibrium of the dynamics simulation
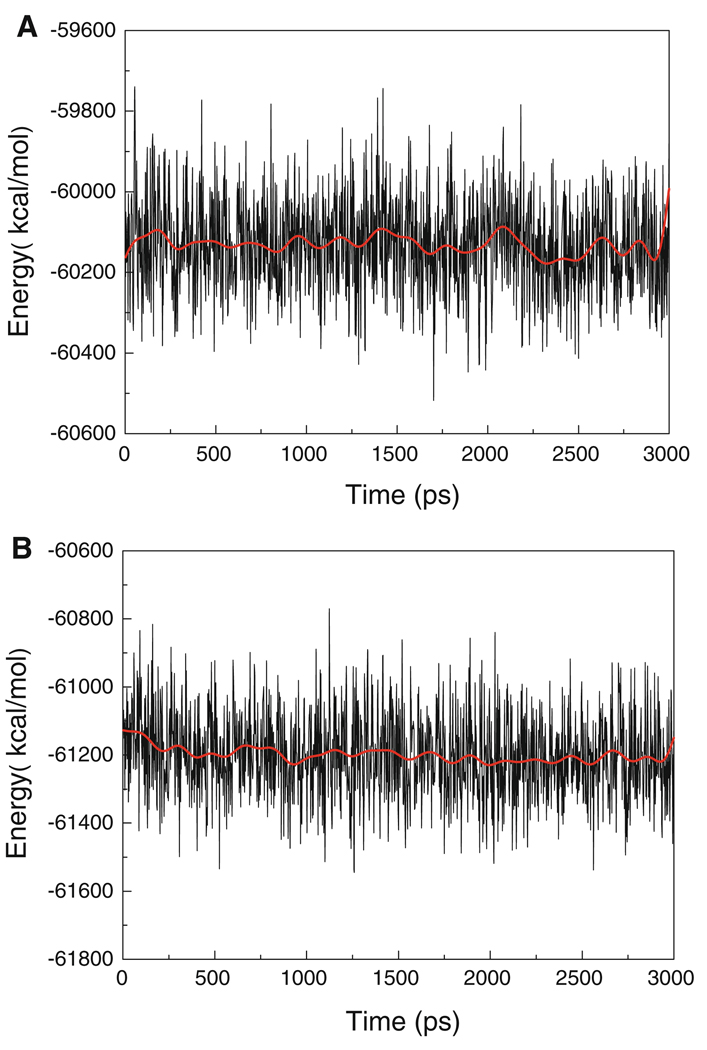
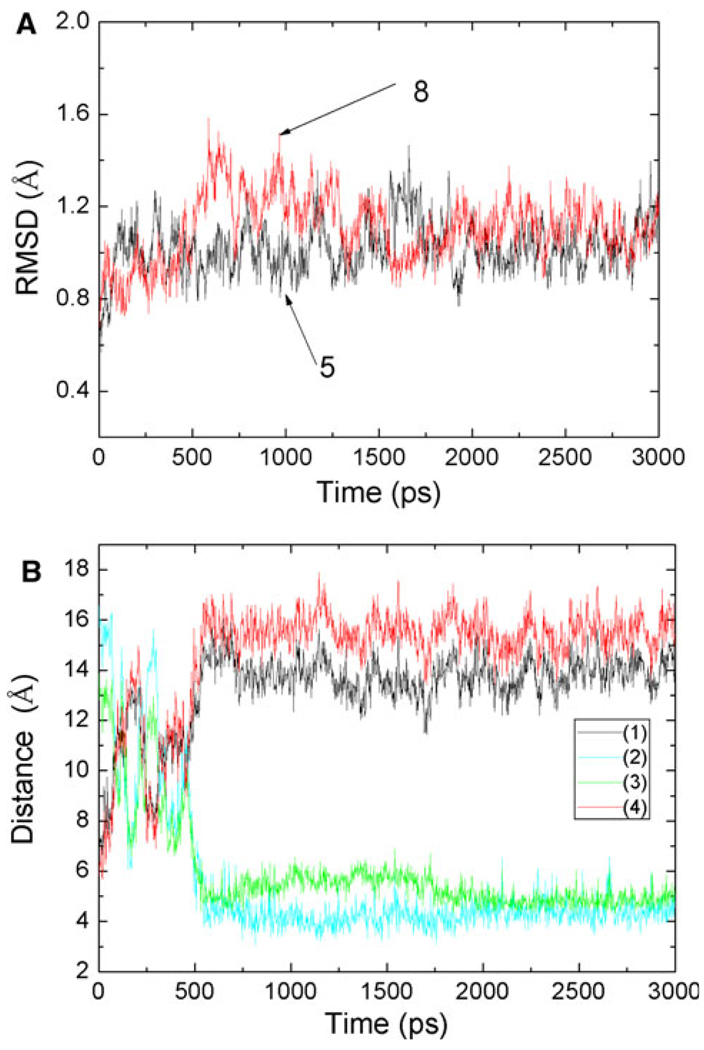
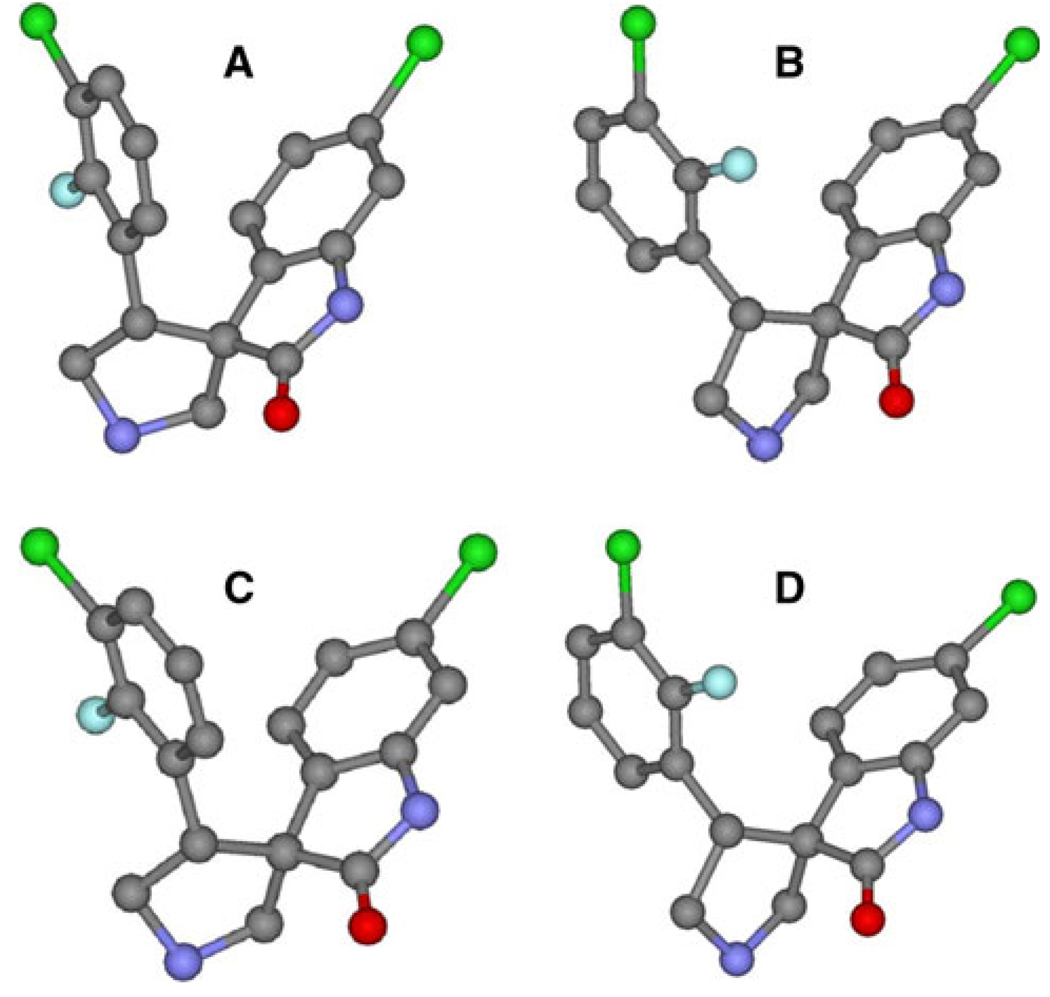
To assess the quality of our MD simulations, energetic and structural properties are monitored along the entire MD trajectory of each complex. The energy plots (Fig. 5) demonstrate that the systems are stable along the entire MD trajectory for MDM2/8 and MDM2/5 complexes, as well as the other ten complexes. The root-mean-square deviations (RMSD) of backbone atoms compared to those of the initial minimized complex structures are obtained over 3 ns trajectories. Figure 6a shows the RMSD for the MDM2/5 and MDM2/8 complexes. An obvious fluctuation is observed in MDM2/8 complex before 1.5 ns, and then it flattens out after that. Figure 6b shows the distances between backbone atom of key residues and atom of G4 group. Figure 6b indicates that the G4 group move from its original position to another position during the first 0.5 ns simulation. The RMSD of MDM2/5 complex is flatter than that of MDM2/8 complex. This implies that the starting structure of MDM2/8 has some unreasonable contact. In order to relieve the unreasonable binding, the active site atoms adjust their position until the system reaches stable. The structure is relaxed during the first 1.5 ns MD simulation, and is equilibrated from the 1.5 ns. The averaged RMSD values of the six complexes are below 1.3 Å over the entire simulation. Particularly, the MD simulations appear to be well equilibrated for MDM2/5 and MDM2/8 complexes, with average RMSD values of 1.02 and 1.11 Å over the last 1 ns, respectively. In order to show the conformation of A-ligands and B-ligands are not changing during the MD simulations, comparison between the relative location of G3 group in A-ligands and B-ligands of inhibitors 5 and 8 from the averaged last 1 ns MD simulations is performed (Fig. 7). We conclude that the different conformations of the same ligands are kept during the MD simulations.
Fig. 5.
The potential energies of MDM2/5 (a) and MDM2/8 (b) complexes observed in MD simulation as function of time. The red solid line represents a 100 ps running average
Fig. 6.
a Root-mean-square deviations of all the backbone atoms on MDM2/5 and MDM2/8 observed in MD simulations as function of time; b the distances between atom of residue and atom of G4 group as function of time, (1) for N of His73 and N2 of G4 group, (2) for O of Phe 55 and O1 of G4, (3) for O or Phe55 and N2 of G4, (4) for N of His 73 and O1 of G4
Fig. 7.
The relative position of G3 in the averaged structure of the last 1 ns MD simulations, all the structures are shown in ball and stick representation with different color of element: a for inhibitor 5 of A-ligand, b for inhibitor 5 of B-ligand, c for inhibitor 8 of A-ligand and d for inhibitor 8 of B-ligand
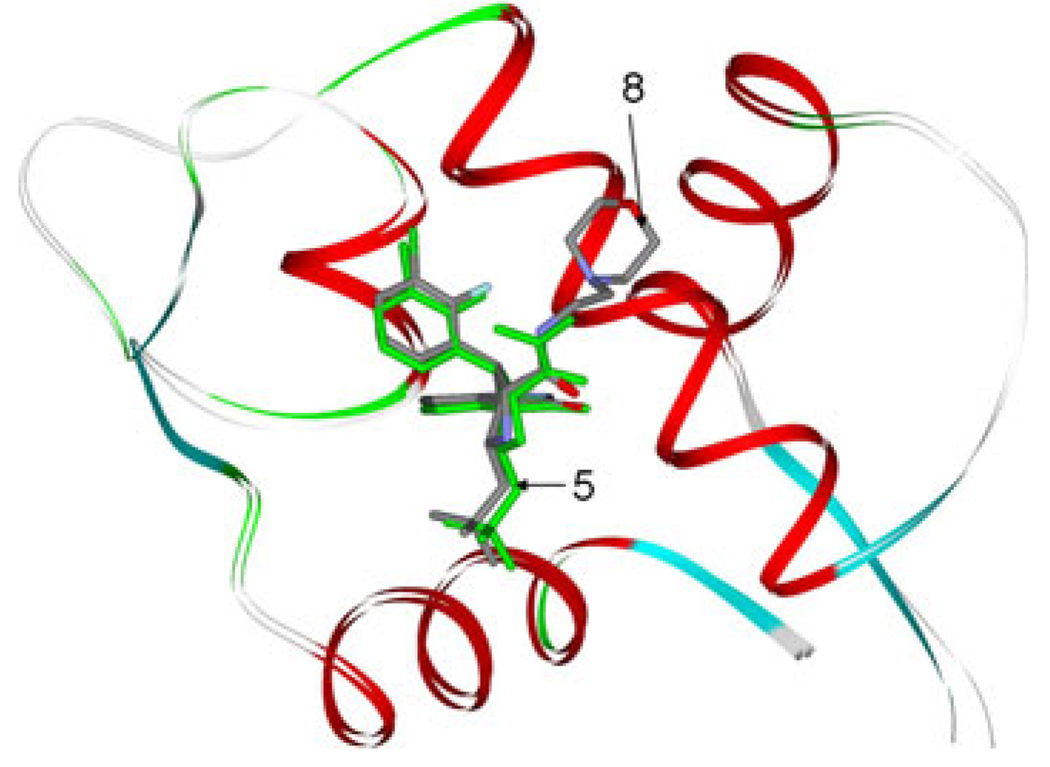
Figure 8 shows the superimposition of the averaged structure from the last 1 ns MD simulation of MDM2/8 complex with MDM2/5 complex. It shows that the two structures agree with each other very well. In addition, comparison of the two average MD structures between the MDM2/8 and MDM2/5 complexes results in a RMSD of backbone at 0.43 Å. This suggests that the strarting structure of MDM2-inhibitors is reasonable with direct modification of the MDM2/8 complex.
Fig. 8.
The averaged structure from the last 1 ns MD simulation of MDM2/5 complex superimposed with the averaged structure of MDM2/8 complex
Calculated binding free energies
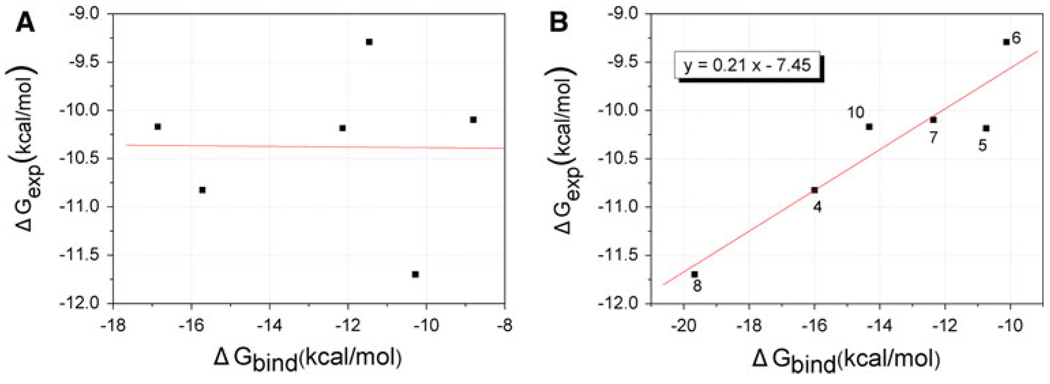
To further examine the starting structure and gain more insights into the contributions of each component to MDM2-inhibitors, MM-PBSA method has been performed to calculate binding free energies (Table 1). The calculated binding free energies (0) are averaged from 100 snapshots which are taken at even intervals from the last 1 ns of MD trajectories for analysis. For B-ligands, a correlation coefficient r = 0.94 between the calculated and experimental binding free energies is obtained (Fig. 9b). However, the correlation coefficient drops to r = −0.01 for A-ligands (Fig. 9a). By comparing Fig. 9a, b, one can see that B-ligands are more consistent with the experimental results. According to intrinsic relative stability and the binding free energies of the two group inhibitors, only B-ligands were selected for the following discussion. Zero also shows the individual energy components contributing to the total calculated binding free energies. The favorable electrostatic terms show higher correlation with experimental affinities (r = 0.66): however, it is offsetted by the unfavorable polar solvation energies. The resulting balance of the two contributions, ΔGele+pol, is unfavorable to binding interactions in all six systems. The correlation coefficients of the free energy terms with the binding experimental affinities are 0.63 for the sum of van der Waals energies and nonpolar solvation energies (ΔGvdw+nonpol), 0.10 for the electrostatic energies and polar solvation energies sum (ΔGele+pol), and 0.34 for the entropy compensation (TΔS), respectively. Despite the low level correlation for ΔGele+pol and TΔS, adding it to ΔGvdw+nonpol term improves the quality of the fit, with an overall correlation coefficient of 0.94 for the total binding free energies. This suggests that although the ΔGvdw+nonpol is important for binding, but the binding free energy arises from a more complex interplay between all of these components. The van der Waals energies are the largest component of the binding free energy for each complex (−30 to −44 kcal/mol). This indicates that the affinities of these inhibitors for MDM2 are dominated by shape complementarity. In Kollman’s work [13], computational alanine scanning results show that the four residues of p53 interaction with MDM2 is driven mainly by van der Waals energies. Overall, these inhibitors may mimic the roles of the four residues in p53 (Phe19, Leu22, Trp23 and Leu26).
Table 1.
Binding free energies computed by the MM-PBSA methoda
| System | ΔEele | ΔEvdw | ΔGnonpol | ΔGpol | ΔGele+pol | ΔGvdw+nonpol | ΔH | –TΔS | ΔGbindb | ΔGbindc | ΔGexpd |
|---|---|---|---|---|---|---|---|---|---|---|---|
| 4 | −6.93 ± 2.66 | −41.56 ± 4.61 | −5.24 ± 0.29 | 16.64 ± 2.68 | 9.71 | −46.8 | −37.11 ±4.10 | −21.11 ± 2.81 | −16.00 | −15.72 | −10.83 |
| 5 | −8.38 ± 2.85 | −30.67 ± 3.43 | −4.7 ± 0.20 | 13.59 ± 3.03 | 5.21 | −35.37 | −30.18 ± 2.65 | −19.44 ± 3.00 | −10.74 | −12.14 | −10.19 |
| 6 | −5.69 ± 2.42 | −35.59 ± 2.31 | −5.11 ±0.12 | 14.69 ± 1.89 | 9.00 | −40.7 | −31.72 ± 2.47 | −21.6 ± 2.22 | −10.12 | −11.46 | −9.29 |
| 7 | −1.84 ± 2.39 | −38.1 ± 2.90 | −5.15 ±0.14 | 11.21 ± 1.83 | 9.37 | −43.25 | −33.9 ± 2.59 | −21.54 ± 3.31 | −12.36 | −8.80 | −10.10 |
| 8 | −13.07 ± 2.39 | −44.67 ± 2.80 | −5.72 ± 0.17 | 21.16 ± 2.35 | 8.09 | −50.39 | −42.31 ± 2.70 | −22.64 ± 4.06 | −19.67 | −10.28 | −11.70 |
| 10 | −8.61 ± 4.15 | −42.7 ± 2.94 | −5.66 ± 0.14 | 20.64 ± 4.83 | 12.03 | −48.36 | −36.35 ± 2.74 | −22.03 ± 2.28 | −14.32 | −16.86 | −10.17 |
| r e | 0.68 | 0.64 | 0.53 | −0.58 | 0.10 | 0.63 | 0.76 | 0.34 | 0.94 | −0.01 |
All values are given in kcal/mol, and the symbols are explained in the text
The binding free energy of B-ligands and MDM2 complex
The binding free energy of A-ligands and MDM2 complex Standard errors of mean values
The experimental binding free energies are calculated using Ki, which are in Ding
Correlation coefficient between the calculated and experimental
Fig. 9.
Comparison between the calculated (ΔGbind) and the experimental (ΔGexp) binding free energies estimated from Ki: a A-ligands and MDM2 complexes; b B-ligands and MDM2 complexes
Binding model prediction of MDM2/inhibitors
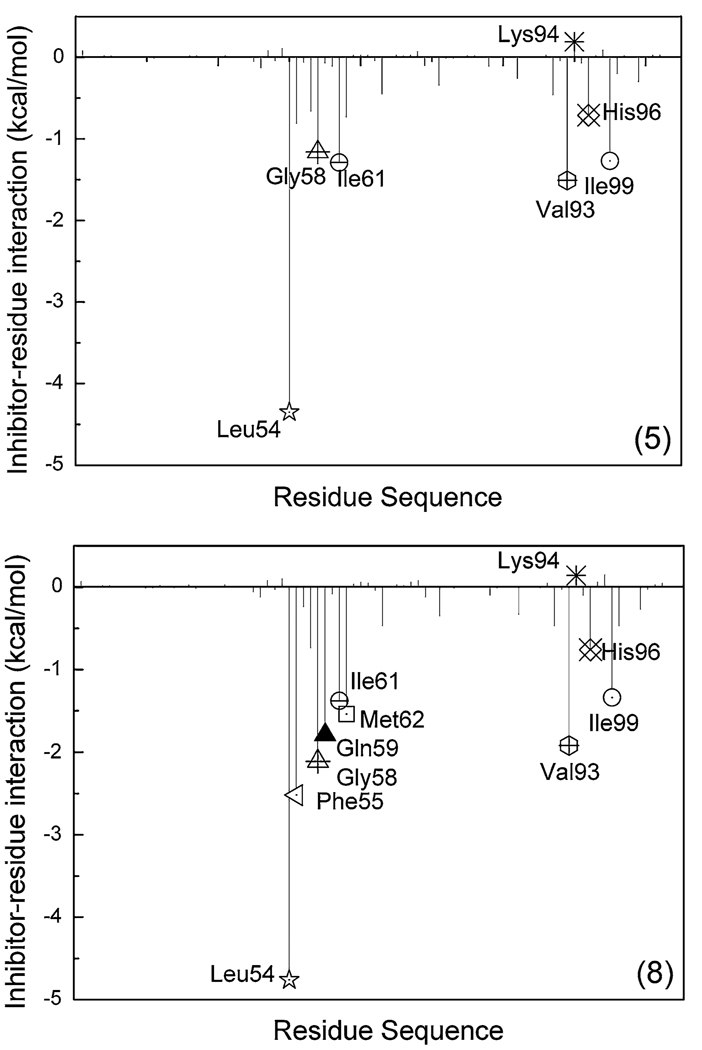
In order to obtain the information about the specific active site residues that influence the relative affinities, the analysis of structure and binding mode have been performed to complement the energy analysis. The binding free energy is decomposed into inhibitor-residue pairs in order to generate an inhibitor-residue interaction spectrum which is shown in Fig. 10. The van der Waals energies of key residues are shown in 0. The decomposed approach is not only extremely useful to elucidate the drug-resistant mechanism at the atomic level, but also helpful to locate residues which contribute to the protease-inhibitor interaction [30, 50, 51]. Comparison between the interaction spectrums of MDM2/8 and MDM2/5 complexes is performed, and the spectrums suggests that five residues (Leu54, Gly58, Ile61, Val93 and Ile99) contribute larger energies in both complexes and three residues (Phe55, Gln59 and Met 62) also contribute larger contribution in MDM2/8 complex.
Fig. 10.
Decomposition of ΔGinhibitor-residue on a per-residue basis for the MDM2/5 and MDM2/8 complex. The residues with interaction energy larger than 1 kcal/mol are labeled, the two residue Lys94 and His96 are also labeled
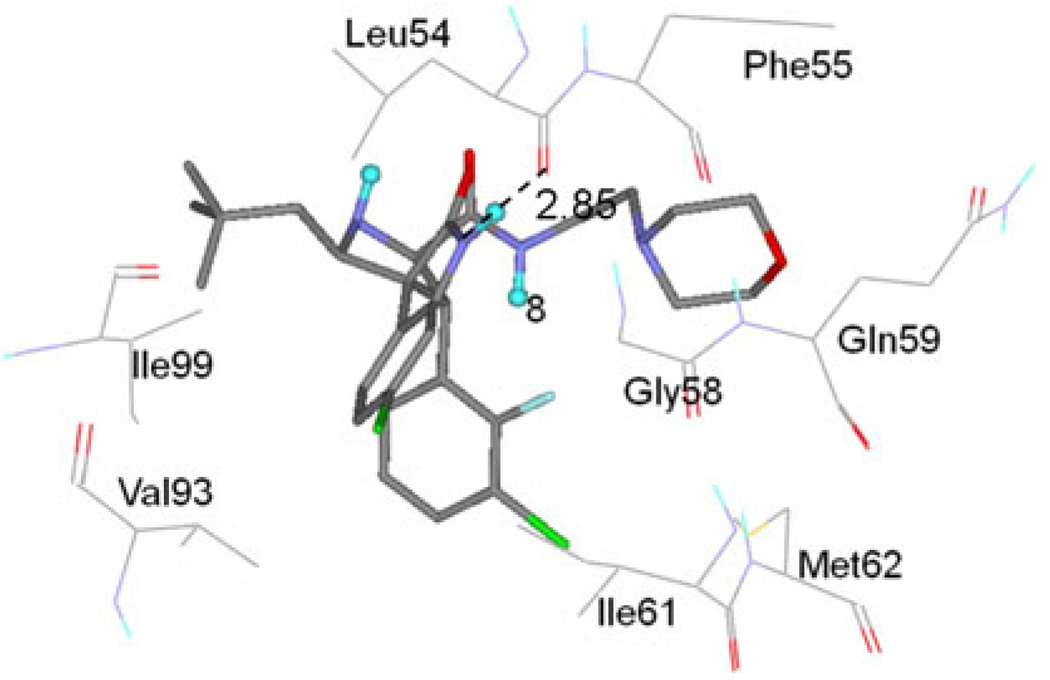
In MDM2-p53 complex, the nitrogen atom of the side chain of Trp23 forms a hydrogen bond with the oxygen atom of the main chain of Leu54 [17]. This information is also demonstrated by the strongest interaction between Trp23 of p53 and Leu54 of MDM2 in Ding’s work [22]. In order to examine if this hydrogen bond is kept or not in these MDM2-inhibitors complexes, the hydrogen bond is examined based on the trajectories of the last 1 ns MD simulation. The oxygen atom of the backbone of Leu54 forms a hydrogen bond with the nitrogen atom of inhibitors (0). The hydrogen bond in each complex shows high % occupied with similar distances and angles. The hydrogen bond between MDM2 and inhibitor 8 is shown in Fig. 11. Therefore, Leu54 must have stronger interaction energy with the inhibitors, especially the electrostatic interaction (−3.79 kcal/mol for MDM2/8 complex). This is confirmed by the inhibitor-residue interaction spectrum (Fig. 10).
Fig. 11.
Geometries of eight residues, which produce major interactions with inhibitor 8, are plotted in the complex structure determined by the averaged structure from the last 1 ns MD simulation. The hydrogen bonds are shown in dash line. Inhibitor 8 is shown in a stick representation. The residues are shown in a line representation
The residues Ile61 and Gly58 contribute larger energies as shown in interaction spectrum (Fig. 10). Crystal structure (PDB code: 1YCR) reveals that Phe19 of p53 makes van der Waals contacts with Gly58 and Ile61 of MDM2, while Trp23 makes van der Waals contacts with Gly58 and Ile61 [17]. The van der Waals energies of these two residues are −2.37 and −1.24 kcal/mol, respectively (0). Gly58’s interaction energy is mainly from the backbone van der Waals energy, and Ile61 from the side chain van der Waals energy (0). As shown in Fig. 11, the residues Gly58 and Ile61 are close to the G1 and G3 group, which means that the van der Waals energies of Gly58 and Ile61 are from the interactions with G1 group and G3 group (Table 2 and Table 3). Figure 12 shows the superimposition of the averaged structure of inhibitor 8 from the last 1 ns MD simulation to p53 peptide conformation in MDM2-p53 crystal structure. One can see that the G1 group of inhibitor 8 in averaged structure agrees with the indole group of Trp23 and the G3 group is in good agreement with the benzene group of residue Phe19. The information implies that the G1 group mimics not only the hydrogen bond but also the van der Waals interaction between the residue Trp23 of the peptide p53 and MDM2, and the role of Phe19 of p53 is kept in this group inhibitors.
Table 2.
Decomposition of ΔGvdw on inhibitor 8 and per-residuea
| Residue | SvdW | BvdW | TvdW |
|---|---|---|---|
| Leu54 | −1.93 | −0.24 | −2.17 |
| Phe55 | −1.39 | −1.09 | −2.48 |
| Gly58 | −0.27 | −2.1 | −2.37 |
| Gln59 | −0.63 | −0.9 | −1.53 |
| Ile61 | −1.01 | −0.23 | −1.24 |
| Met62 | −1.39 | −0.24 | −1.64 |
| Val93 | −1.26 | −0.65 | −1.91 |
| His96 | −0.91 | −0.32 | −1.23 |
| Ile99 | −1.31 | −0.13 | −1.44 |
Energies shown as contribution from van der Waals energy (vdW) of side chain atom (S), backbone atom (B), and the sum of them (T). Energies are in kcal/mol
Table 3.
Hydrogen bonds formed by oxygen atom of Leu54 with the nitrogen atom of inhibitor
| System | Occua | Distanceb | Angleb |
|---|---|---|---|
| 4 | 99.73 | 2.874 | 161.18 |
| 5 | 99.93 | 2.869 | 162.18 |
| 6 | 99.2 | 2.91 | 160.86 |
| 7 | 99.67 | 2.883 | 159.81 |
| 8 | 98.8 | 2.848 | 162.50 |
| 10 | 97.40 | 2.893 | 160.93 |
% occup: to evaluate the stability and the strength of the hydrogen bonds
The hydrogen bonds are determined by acceptor…donor atom distance of less than 3.5 Å and acceptor…H -donor angle of great than 120°
Fig. 12.
Superposition of the averaged structure of compound 8 to the p53 peptide conformation in the crystal structure of p53 peptide conformation in complex with MDM2. Four residues, Phe19, Leu22, Try23, and Leu26 in ball and stick representation. The compound 8 is colored in green with stick representation
Alanine scanning demonstrates that Leu26 interaction with MDM2 is mainly driven by the van der Waals energy [13]. The crystal structure and the quantum mechanical calculation show the residue His96 interacts with Leu26. Our calculated results show that the van der Waals energy is the main force which drives the binding of inhibitor with His96 (0). The position of G2 group in inhibitor 8 overlaps well with the side chain of Leu26 (Fig. 12), which enables us to draw a conclusion that the G2 group of inhibitor mimics the Leu26 side chain.
In Ding’s work [22], the interactions of residue Leu22 with Lys94 and His96 result in favorable energies. In Ding’s work, the results predicted for inhibitor 4 by the GOLD program shows the G4 group mimics the role of Leu22 and the charge-charge interaction between Glu17 and Lys94. Based on the above work, the residue Lys94 and His96 must have strong interactions with inhibitor 8. However, the interaction spectrum of inhibitor 8 (Fig. 10) shows that the interaction energy of Lys94 is repulsive and the one of His96 is very small, and G4 group in the averaged MD structure is different from the starting structure (Fig. 13). The information implies that the location of G4 group is changed in the MD simulation process and the small interaction energy of His96 is from G2 group. This is consistent with the larger RMSD fluctuation in the fist 1.5 ns MD simulation compared with MDM2/5 complex. We conclude that the G4 group can not mimic the residue Leu22.
Fig. 13.
The strarting structure of MDM2/8 complex (A) superimposed with the averaged structure from the last 1 ns MD simulation of this complex (B)
There are three residues Phe55, Gln59, and Met62 with larger interaction energies in MDM2/8 complex than in MDM2/5 complex (Fig. 10). These results imply that the replacement of the N,N-dimethylamine group in inhibitor 5 with G4 group in inhibitor 8 prominently increases the number of residues which interact with the inhibitor. The G4 group in inhibitor 8 doesn’t change the binding model of others group compared with inhibitor 4 and the G4 group may increase interaction energy with the MDM2. For Phe55, favorable van der Waals energy (2.47 kcal/mol in 0 and Fig. 11) is produced by the C–H…π interactions between G4 group in inhibitor 8 and the benzene group of Phe55 and the C–H…O interactions between the G4 group in inhibitor 8 and the oxygen atom of the Phe55 main chain. The energies of these three residues mainly arise from the van der Waals energy (0).
Conclusion
Quantum chemistry calculation is used to decide the reasonable conformation of six inhibitors. The results show that the B-ligands are more stable than A-ligands. Molecular docking, combined MD simulations, and MM-PBSA binding free energy calculation are performed on six complexes to investigate the binding model and to evaluate their binding affinities. For the B-ligands, the calculated result shows a higher correlation coefficient (r = 0.94) between the experimentally determined and computed binding free energies. The binding free energy calculation also shows that the B-ligands are consistent with the experimental results. Further examination indicates that the van der waals energies are the most component of the total energies, indicating that this group inhibitors may mimic the four residues of p53 in the term of interaction energy with MDM2. The hydrogen bond formed between p53 and MDM2 is well kept in this group inhibitors. The structure analysis and the decomposition of free energies on a perresidue basis show that the G1, G2 and G3 group mimic the role of Trp23, Leu26 and Phe19 of p53, respectively. The G4 group in average structure is different from in the starting structure. It interacts with the residues Phe55, Gln59, and Met62 of MDM2 by C–H…π and C–H…O interactions. The binding mode of G4 group is remarkably different from that proposed previously based on simple molecular docking tests, and it doesn’t mimic the residues Leu22 of p53. The information obtained from this study will be valuable not only for future rational design of novel, more potent MDM2-specific inhibitors as promising anticancer therapeutics, but also for rational design of drugs targeting other proteins.
Acknowledgments
This work is supported by NIH grant (Grant No. SC3 GM084834), the National Nature Science Foundation of China (Grant No. 10874104), the Research Fund for the Doctoral Program of Higher Education of China (20093704110001), the key Project of Nature Science Foundation of Shandong Province (Z2007A05) and Shandong Province Foundation for Middle-aged and Young Scientist (2008BS01013).
Contributor Information
Guodong Hu, College of Physics and Electronics, Shandong Normal University, 250014 Jinan, China; Department of Physics, University of Texas at San Antonio, San Antonio, TX 78249, USA.
Dunyou Wang, College of Physics and Electronics, Shandong Normal University, 250014 Jinan, China.
Xinguo Liu, College of Physics and Electronics, Shandong Normal University, 250014 Jinan, China.
Qinggang Zhang, College of Physics and Electronics, Shandong Normal University, 250014 Jinan, China, zhangqg@sdnu.edu.cn.
References
- 1.Vogelstein B, Lane D, Levine AJ. Nature. 2000;408:307–310. doi: 10.1038/35042675. [DOI] [PubMed] [Google Scholar]
- 2.Levine AJ. Cell. 1997;88:323–331. doi: 10.1016/s0092-8674(00)81871-1. [DOI] [PubMed] [Google Scholar]
- 3.Wu X, Bayle JH, Olson D, Levine AJ. Genes Dev. 1993;7:1126–1132. doi: 10.1101/gad.7.7a.1126. [DOI] [PubMed] [Google Scholar]
- 4.Hollstein M, Sidransky D, Vogelstein B, Harris CC. Science. 1991;253:49–53. doi: 10.1126/science.1905840. [DOI] [PubMed] [Google Scholar]
- 5.Oliner JD, Kinzler KW, Meltzer PS, George DL, Vogelstein B. Nature. 1992;358:80–83. doi: 10.1038/358080a0. [DOI] [PubMed] [Google Scholar]
- 6.Kumar SK, Hager E, Pettit C, Gurulingappa H, Davidson NE, Khan SR. J Med Chem. 2003;46:2813–2815. doi: 10.1021/jm030213+. [DOI] [PubMed] [Google Scholar]
- 7.Chène P. Nat Rev Cancer. 2003;3:102–109. doi: 10.1038/nrc991. [DOI] [PubMed] [Google Scholar]
- 8.Vassilev LT, Vu BT, Graves B, Carvajal D, Podlaski F, Filipovic Z, Kong N, Kammlott U, Lukacs C, Klein C. Science. 2004;303:844–848. doi: 10.1126/science.1092472. [DOI] [PubMed] [Google Scholar]
- 9.Ding K, Lu Y, Nikolovska-Coleska Z, Qiu S, Ding Y, Gao W, Stuckey J, Krajewski K, Roller PP, Tomita Y, Parrish DA, Deschamps JR, Wang S. J Am Chem Soc. 2005;127:10130–10131. doi: 10.1021/ja051147z. [DOI] [PubMed] [Google Scholar]
- 10.Grasberger BL, Lu T, Schubert C, Parks DJ, Carver TE, Koblish HK, Cummings MD, LaFrance LV, Milkiewicz KL, Calvo RR, Maguire D, Lattanze J, Franks CF, Zhao S, Ramachandren K, Bylebyl GR, Zhang M, Manthey CL, Petrella EC, Pantoliano MW, Deckman IC, Spurlino JC, Maroney AC, Tomczuk BE, Molloy CJ, Bone RF. J Med Chem. 2005;48:909–912. doi: 10.1021/jm049137g. [DOI] [PubMed] [Google Scholar]
- 11.Vassilev LT. J Med Chem. 2005;48:4491–4499. doi: 10.1021/jm058174k. [DOI] [PubMed] [Google Scholar]
- 12.Hang Y, Gui-in L, Hyung Soon P, Gregory AP, Johanna MR, Said MS, Andrew DH. Angew Chem Int Ed. 2005;44:2704–2707. [Google Scholar]
- 13.Massova I, Kollman PA. J Am Chem Soc. 1999;121:8133–8143. [Google Scholar]
- 14.Dastidar SG, Madhumalar A, Fuentes G, Lane DP, Verma CS. Theor Chem Acct. 2010;125:621–635. [Google Scholar]
- 15.Chen H-F, Luo R. J Am Chem Soc. 2007;129:2930–2937. doi: 10.1021/ja0678774. [DOI] [PMC free article] [PubMed] [Google Scholar]
- 16.Espinoza-Fonseca LM, Trujillo-Ferrara JG. Biopolymer. 2006;83:365–373. doi: 10.1002/bip.20566. [DOI] [PubMed] [Google Scholar]
- 17.Kussie PH, Gorina S, Marechal V, Elenbaas B, Moreau J, Levine AJ, Pavletich NP. Science. 1996;274:948. doi: 10.1126/science.274.5289.948. [DOI] [PubMed] [Google Scholar]
- 18.Ding K, Lu Y, Nikolovska-Coleska Z, Wang G, Qiu S, Shangary S, Gao W, Qin D, Stuckey J, Krajewski K, Roller PP, Wang S. J Med Chem. 2006;49:3432–3435. doi: 10.1021/jm051122a. [DOI] [PubMed] [Google Scholar]
- 19.Bowman AL, Nikolovska-Coleska Z, Zhong H, Wang S, Carlson HA. J Am Chem Soc. 2007;129:12809–12814. doi: 10.1021/ja073687x. [DOI] [PubMed] [Google Scholar]
- 20.Lin J, Chen J, Elenbaas B, Levine AJ. Genes Dev. 1994;8:1235–1246. doi: 10.1101/gad.8.10.1235. [DOI] [PubMed] [Google Scholar]
- 21.Picksley SM, Vojtesek B, Sparks A, Lane DP. Oncogene. 1994;9:2523–2529. [PubMed] [Google Scholar]
- 22.Ding Y, Mei Y, Zhang JZH. J Phys Chem B. 2008;112:11396–11401. doi: 10.1021/jp8015886. [DOI] [PubMed] [Google Scholar]
- 23.Wang W, Donini O, Reyes CM, Kollman PA. Annu Rev Biophys Biomol Struct. 2001;30:211–243. doi: 10.1146/annurev.biophys.30.1.211. [DOI] [PubMed] [Google Scholar]
- 24.Roux B, Nina M, Pomès R, Smith JC. Biophys J. 1996;71:670–681. doi: 10.1016/S0006-3495(96)79267-6. [DOI] [PMC free article] [PubMed] [Google Scholar]
- 25.Essex JW, Severance DL, Tirado-Rives J, Jorgensen WL. J Phys Chem B. 1997;101:9663–9669. [Google Scholar]
- 26.Marco E, Negri A, Luque FJ, Gago F. Nucleic Acids Res. 2005;33:6214–6224. doi: 10.1093/nar/gki916. [DOI] [PMC free article] [PubMed] [Google Scholar]
- 27.Kollman PA, Massova I, Reyes C, Kuhn B, Huo S, Chong L, Lee M, Lee T, Duan Y, Wang W, Donini O, Cieplak P, Srinivasan J, Case DA, Cheatham TE. Acc Chem Res. 2000;33:889–897. doi: 10.1021/ar000033j. [DOI] [PubMed] [Google Scholar]
- 28.Luo R, David L, Gilson MK. J Comput Chem. 2002;23:1244–1253. doi: 10.1002/jcc.10120. [DOI] [PubMed] [Google Scholar]
- 29.Stoica I, Sadiq SK, Coveney PV. J Am Chem Soc. 2008;130:2639–2648. doi: 10.1021/ja0779250. [DOI] [PubMed] [Google Scholar]
- 30.Hou TJ, Yu R. J Med Chem. 2007;50:1177–1188. doi: 10.1021/jm0609162. [DOI] [PubMed] [Google Scholar]
- 31.Ode H, Neya S, Hata M, Sugiura W, Hoshino T. J Am Chem Soc. 2006;128:7887–7895. doi: 10.1021/ja060682b. [DOI] [PubMed] [Google Scholar]
- 32.Ode H, Matsuyama S, Hata M, Hoshino T, Kakizawa J, Sugiura W. J Med Chem. 2007;50:1768–1777. doi: 10.1021/jm061158i. [DOI] [PubMed] [Google Scholar]
- 33.Wang W, Kollman PA. Proc. Natl Acad Sci USA. 2001;98:14937–14942. doi: 10.1073/pnas.251265598. [DOI] [PMC free article] [PubMed] [Google Scholar]
- 34.Hu G-D, Zhu T, Zhang S-L, Wang D, Zhang Q-G. Eur J Med Chem. 2010;45:227–235. doi: 10.1016/j.ejmech.2009.09.048. [DOI] [PubMed] [Google Scholar]
- 35.AbdulHameed MDM, Hamza A, Zhan C-G. J Phys Chem B. 2006;110:26365–26374. doi: 10.1021/jp065207e. [DOI] [PubMed] [Google Scholar]
- 36.Frisch MJ, Trucks GW, Schlegel HB, Scuseria GE, Robb MA, Cheeseman JR, Montgomery JA, Jr, Vreven T, Kudin KN, Burant JC, Millam JM, Iyengar SS, Tomasi J, Barone V, Mennucci B, Cossi M, Scalmani G, Rega N, Petersson GA, Nakatsuji H, Hada M, Ehara M, Toyota K, Fukuda R, Hasegawa J, Ishida M, Nakajima T, Honda Y, Kitao O, Nakai H, Klene M, Li X, Knox JE, Hratchian HP, Cross JB, Bakken V, Adamo C, Jaramillo J, Gomperts R, Stratmann RE, Yazyev O, Austin AJ, Cammi R, Pomelli C, Ochterski JW, Ayala PY, Morokuma K, Voth GA, Salvador P, Dannenberg JJ, Zakrzewski VG, Dapprich S, Daniels AD, Strain MC, Farkas O, Malick DK, Rabuck AD, Raghavachari K, Foresman JB, Ortiz JV, Cui Q, Baboul AG, Clifford S, Cioslowski J, Stefanov BB, Liu G, Liashenko A, Piskorz P, Komaromi I, Martin RL, Fox DJ, Keith T, Al-Laham MA, Peng CY, Nanayakkara A, Challacombe M, Gill PMW, Johnson B, Chen W, Wong MW, Gonzalez C, Pople JA. Gaussian 03, revision C.02. Wallingford: Gaussian Inc; 2004. [Google Scholar]
- 37.Cornell WD, Cieplak P, Bayly CI, Gould IR, Merz KM, Ferguson DM, Spellmeyer DC, Fox T, Caldwell JW, Kollman PA. J Am Chem Soc. 2002;117:5179–5197. [Google Scholar]
- 38.Cieplak P, Cornell WD, Bayly C, Kollman PA. J Comput Chem. 1995;16:1357–1377. [Google Scholar]
- 39.Wang JM, Wolf RM, Caldwell JW, Kollman PA, Case DA. J Comput Chem. 2004;25:1157–1174. doi: 10.1002/jcc.20035. [DOI] [PubMed] [Google Scholar]
- 40.Yong D, Chun W, Shibasish C, Mathew CL, Guoming X, Wei Z, Rong Y, Piotr C, Ray L, Taisung L, James C, Junmei W, Peter K. J Comput Chem. 2003;24:1999–2012. [Google Scholar]
- 41.Jorgensen WL, Chandrasekhar J, Madura JD, Impey RW, Klein ML. J Chem Phys. 1983;79:926–935. [Google Scholar]
- 42.Ruth H, Garrett MM, Arthur JO, David SG. J Comput Chem. 2007;28:1145–1152. [Google Scholar]
- 43.Huey R, Goodsell DS, Morris GM, Olson AJ. Lett Drug Des Discov. 2004;1:178–183. [Google Scholar]
- 44.Case DA, Darden TA, Cheatham TEIII, Simmerling CL, Wang J, Duke RE, Luo R, Merz KM, Pearlman DA, Crowley M, Walker RC, Zhang W, Wang B, Hayik S, Roitberg A, Seabra G, Wong KF, Paesani F, Wu X, Brozell S, Tsui V, Gohlke H, Yang L, Tan C, Mongan J, Hornak V, Cui G, Beroza P, Mathews DH, Schafmeister C, Ross WS, Kollman PA. AMBER. San Francisco: University of California; 2006. p. 9. [Google Scholar]
- 45.Darden T, York D, Pedersen L. J Chem Phys. 1993;98:10089–10092. [Google Scholar]
- 46.Ryckaert JP, Ciccotti G, Berendsen HJC. J Comput Phys. 1977;23:327–341. [Google Scholar]
- 47.Michel FS, Arthur JO, Jean-Claude S. Biopolymers. 1996;38:305–320. [Google Scholar]
- 48.Sitkoff D, Sharp KA, Honig B. J Phys Chem. 1994;98:1978–1988. [Google Scholar]
- 49.Case DA. Curr Opin Struct Biol. 1994;4:285–290. [Google Scholar]
- 50.Rafi SB, Cui G, Song K, Cheng X, Tonge PJ, Simmerling C. J Med Chem. 2006;49:4574–4580. doi: 10.1021/jm060222t. [DOI] [PubMed] [Google Scholar]
- 51.Wu EL, Han KL, Zhang JZH. Chem Eur J. 2008;14:8704–8714. doi: 10.1002/chem.200800277. [DOI] [PubMed] [Google Scholar]


