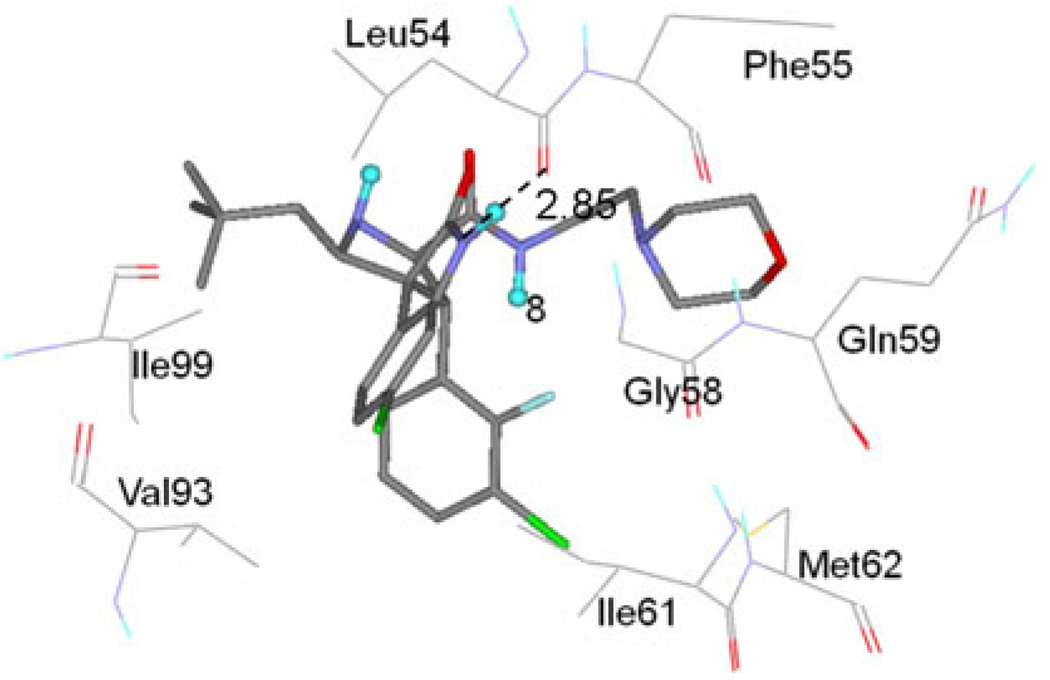
Fig. 11.
Geometries of eight residues, which produce major interactions with inhibitor 8, are plotted in the complex structure determined by the averaged structure from the last 1 ns MD simulation. The hydrogen bonds are shown in dash line. Inhibitor 8 is shown in a stick representation. The residues are shown in a line representation

