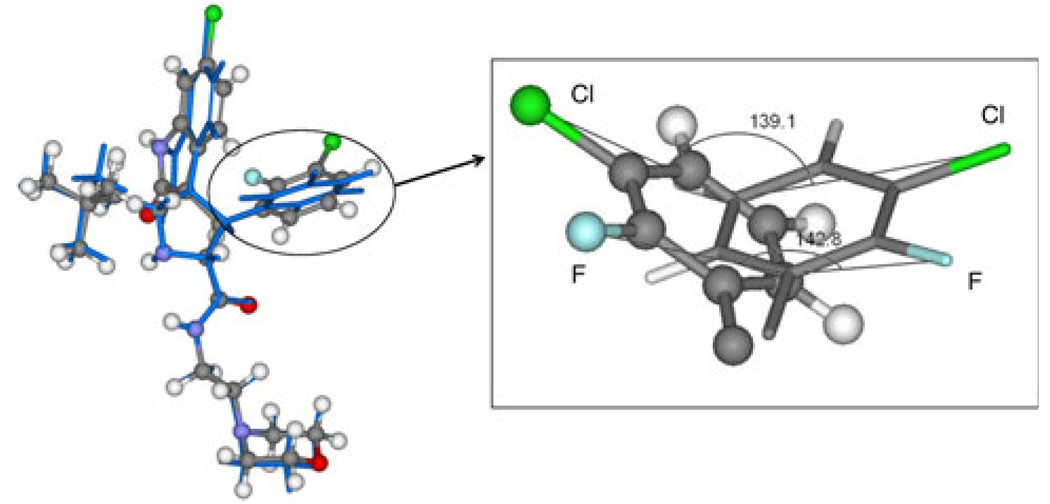
Fig. 2.
Left picture is the conformation A overlapped with conformation B of inhibitor 8. The conformation A is shown in stick and ball represents with different color of element, the conformation B is shown in stick represents with blue. The right one is the enlargement for the G3 group. All the atoms is labeled by different color of element. Two angles are labeled

