
Figure 3.
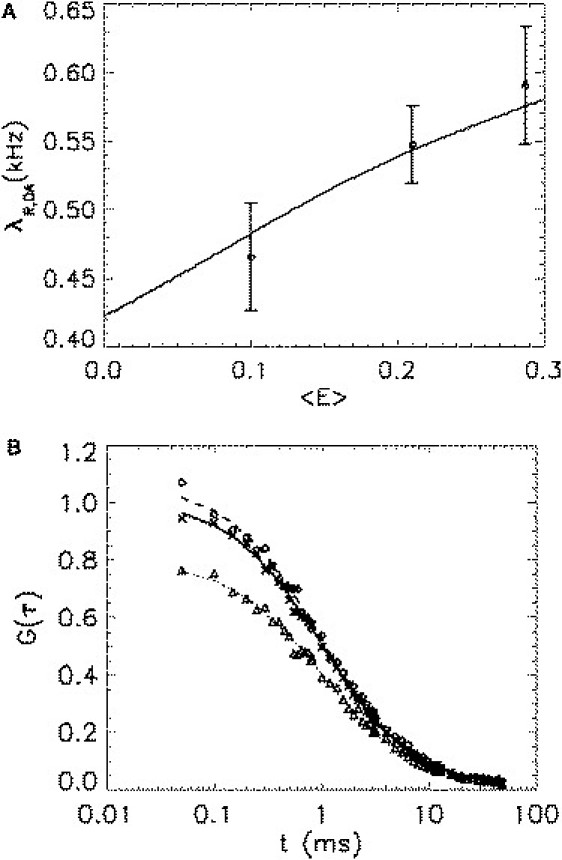
Single-channel and cross-correlation analysis of hetero-dimers. (A) The solid line shows the red-channel brightness of a heterodimer DA as a function of the average FRET efficiency as predicted by the two-state model with parameters taken from Table 1. The symbols represent the experimentally determined red-channel brightness and average FRET efficiency of three heterodimers (G-RARLBD-Ch, G-Ch, and Ch-G). (B) The red-channel autocorrelation function (diamonds) and the cross-correlation function (triangles) of Ch-G are compared with the green-channel autocorrelation function (exes). The experimental correlation curves are normalized with respect to the green-channel autocorrelation amplitude and then averaged across 10 cells. The lines represent the fit of the data to a simple diffusion model (Eq. 15). The three correlation curves do not overlap as a result of the two-state model of mCherry. The difference in the correlation amplitudes agrees with the two-state model as shown in Table 2.