
Figure 5.
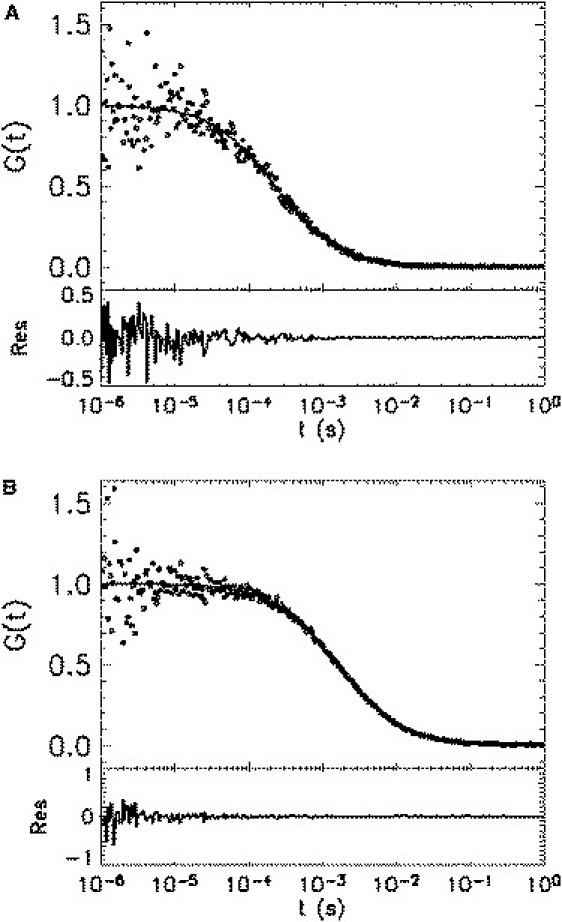
Cross-correlation function of mCherry in solution. (A) Purified mCherry is dissolved in PBS and measured for 10 min with a 50/50 beam splitter. The normalized Experimental cross-correlation function (symbols) is plotted together with the fit (solid line) to Eq. 15. The diffusion time returned from the fit is 0.23 ms, which closely matches that of EGFP measured under the same experimental conditions. (B) Cross-correlation function (symbols) of mCherry in a solution with higher viscosity (PBS with 50% glycerol). A fit (solid line) of the cross-correlation curve to Eq. 15 yields a diffusion time of 1.6 ms. Note that both correlation curves are well described by a simple diffusion model without any additional kinetic processes.