
Figure 1.
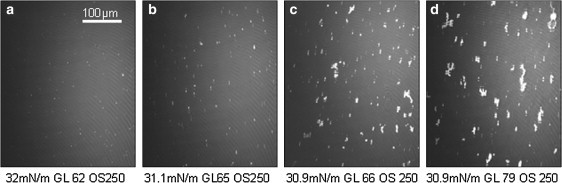
BAM images of a PC/PE/CL (2:1:1) monolayer before mtCK injection (a) and 20 min (b), 60 min (c), and 140 min (d) after mtCK injection. Lateral surface pressure, gray level (GL), and obturation speed (OS) are indicated below each image.
Official websites use .gov
A
.gov website belongs to an official
government organization in the United States.
Secure .gov websites use HTTPS
A lock (
) or https:// means you've safely
connected to the .gov website. Share sensitive
information only on official, secure websites.
BAM images of a PC/PE/CL (2:1:1) monolayer before mtCK injection (a) and 20 min (b), 60 min (c), and 140 min (d) after mtCK injection. Lateral surface pressure, gray level (GL), and obturation speed (OS) are indicated below each image.