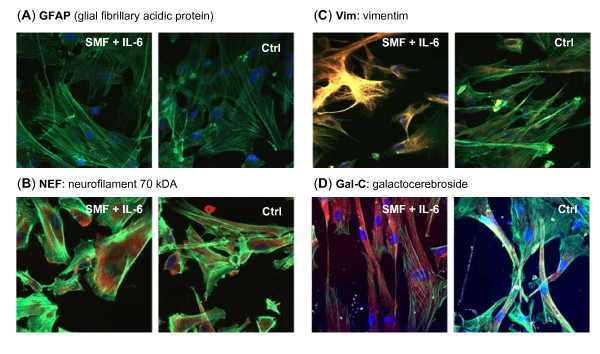
Figure 10.
Differentiation markers in SMF- and IL-6-treated hEBD LVEC cells. Test cells were incubated with 4.0 ng/ml IL-6 with concurrent SMF exposure (controls were incubated with neither) and the monolayers were co-stained with Oregon Green 488 phalloidin to visualize actin, the nuclear dye DAPI (blue), and one of the following markers (red): (A) the astrocyte marker GFAP (note that the lack of staining indicates the absence of this marker in both treated and control cells); (B) the neuron marker NEF; and the pre-oligodendrocyte markers (C) Vim and (D) Gal-C. Images were obtained by confocal microscopy using identical exposure settings for each set of photographs.

