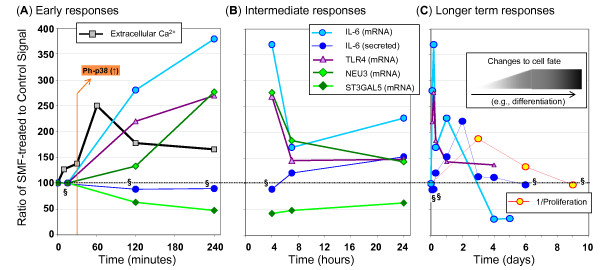
Figure 11.
Timeline of SMF-induced, IL-6 associated responses in hEBD LVEC cells. Data is compiled from experiments reported throughout this paper to show (A) early responses that occur within four hours of the start of continuous SMF exposure, (B) intermediate responses that occur over the first day, and (C) longer term responses over the first week or so of SMF exposure. Data is shown for n ≥ 3 independent experiments and p < 0.05 for all data except for that indicated by "§" where p > 0.05 (these data were analyzed by SD but error bars are omitted from these graphs for clarity). All data shown – except for the proliferation data in Panel C that gives the reciprocal relationship – compares SMF-exposed to control cells with a value of 100 as a baseline.

