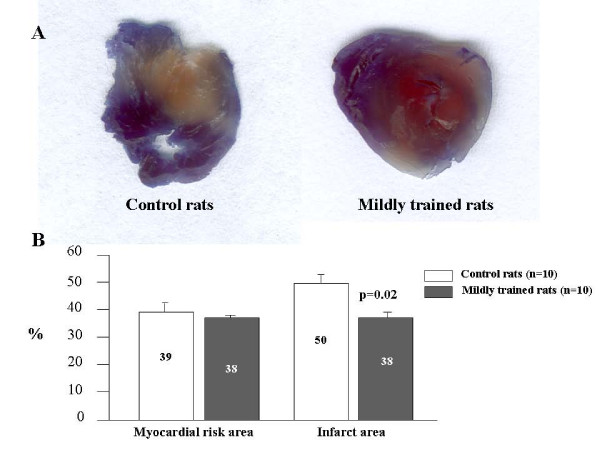
Figure 4.
I/R experiments: A = images of a heart from control and mildly exercised rats: blue = perfused myocardium; red = area at risk; white = infarct tissue. B = mean percentages ± SE of myocardial risk areas at the end of 30 min-ischemia followed by 90 min-reperfusion and of infarct areas (values are representative of total ventricle percentage).

