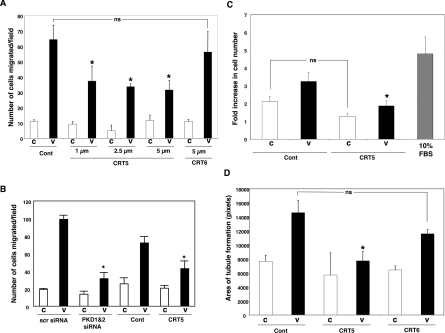
Figure 5. Effect of CRT5 on VEGF-induced migration and tubulogenesis.
(A) HUVECs were trypsinized and incubated for 30 min in the presence of vehicle (Cont; 0.08% DMSO), 1–5 μM CRT5 or 5 μM CRT6 before being added to the upper chamber of a Transwell migration assay chamber. Vehicle (C) or 25 ng/ml VEGF (V) was added to the lower chamber and the cells were allowed to migrate at 37 °C. After 4 h, the inserts were fixed, stained and migrated cells were counted. Quantified results are expressed as the mean number of cells migrating per field for at least three independent experiments. Migration towards vehicle is represented by white bars and towards VEGF by black bars. Results were analysed by one-way ANOVA; *P<0.05 compared with vehicle plus VEGF. (B) HUVECs were transfected with 200 nM PKD1 and PKD2 siRNA, or 400 nM control siRNA (scr), for 48 h. In a parallel set of experiments, non-transfected HUVECs were trypsinized and incubated for 30 min in the presence of vehicle (Cont; 0.08% DMSO) or 5 μM CRT5. Cells were then used to determine migration in response to 25 ng/ml VEGF in a Transwell migration assay as described in the Materials and methods section. Quantified results are expressed as the mean number of cells migrating per field for at least three independent experiments. Migration towards vehicle is represented by white bars and towards VEGF by black bars. Two-way ANOVA indicated a significant inhibitor, interaction and treatment effects (P<0.0001). Significant differences of interest are indicated on the histogram: *P<0.001 compared with scr siRNA plus VEGF or vehicle plus VEGF respectively as determined by Bonferroni's post hoc test. (C) HUVECs were seeded at a density of 3.2×10⁴ cells/ml and allowed to attach to a gelatin-coated 24-well plate for 4 h. The complete medium was then replaced with 0.5% FCS/EBM with 2.5 μM CRT5 or vehicle (Cont) or 10% (v/v) FCS/EBM (grey bar). After 30 min, cells were treated with 25 ng/ml VEGF (black bars) or vehicle (white bars) as indicated. After 48 h, cells were trypsinized and counted using a Sysmex CDA-500 cell counter. The results are expressed as the fold increase in cell number from the original seeding density and are means±S.E.M. for three independent experiments. Results were analysed by one-way ANOVA; *P<0.05 compared with vehicle plus VEGF. (D) HUVECs were trypsinized and incubated for 30 min in the presence of vehicle (Cont; 0.08% DMSO), 5 μM CRT5 or 5 μM CRT6 in EBM containing 0.3% FCS. Cells were then plated on to a collagen base as described in the Materials and Methods section. Cells plated on to collagen were then incubated for 16 h either with no addition (C, white bars) or with 25 ng/ml VEGF (black bars). Tubulogenesis was quantified with ImageJ. ANOVA indicates that CRT5 significantly reduced VEGF-mediated tube formation whereas CRT6 had no significant effect. *P<0.05 compared with VEGF (no inhibitor) as determined by Bonferroni's post hoc test. Values (n≥3) are means±S.E.M., expressed as the area of tubules formed in pixels per field.

