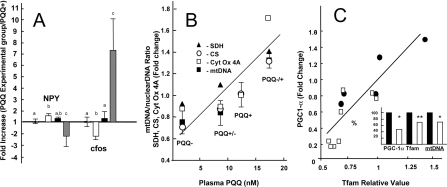
Figure 3. NPY, c-fos, mtDNA/nuclear DNA ratio, and relative changes in succinic acid dehydrogenase, citrate synthetase, cytochrome oxidase-related transcripts, PGC-1α and Tfam in response to dietary PQQ status.
(A) Changes in NPY and c-fos levels in response to changes in PQQ exposure. Values represent fold changes in expression relative to a corresponding control group. Ratios: Control, PQQ+/PQQ+ (=1.0), PQQ deficient, PQQ−/PQQ+ (white bars); PQQ partially depleted PQQ(+/−)/PQQ+ (black bars); PQQ-repleted PQQ(−/+)/PQQ− (grey bars). The superscript letter values indicate that there was a difference between groups (P<0.05 using a Dunnett's post-test). (B) Plasma PQQ and the relative content or fold changes for liver mtDNA and succinic acid dehydrogenase (SDH), citrate synthetase (CS) and cytochrome oxidase-related transcripts (Cyt OX). Values for r2 (plasma PQQ compared with relative fold-changes) ranged from approx. 0.72 to 70.95. (C) Relationship of Tfam to PGC-1α (relative changes in transcript levels) in PQQ− rats (□) or PQQ+ rats (●). Changes in PGC-1α and Tfam transcripts levels (estimated by qRT-PCR) and the mtDNA/nuclear DNA ratio are expressed as a percentage of control values (insert). *P<0.05; **P<0.2.

