
Figure 4.
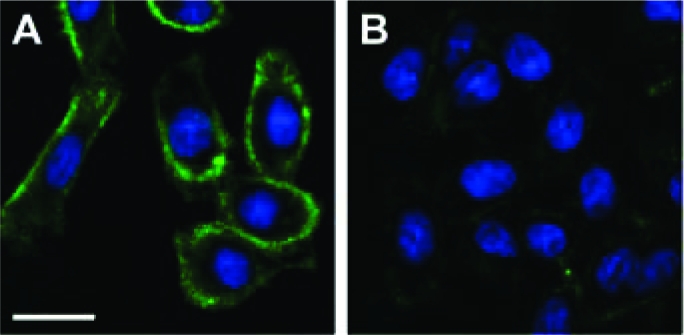
Selective imaging of cells using 1 in the presence of PSA. Fluorescence microscopy analysis of CHO cells treated with 1 (100 μM) and (A) PSA (50 μg/mL) or (B) HK PSA (50 μg/mL), followed by DIFO−biotin (100 μM) and a quantum dot 605−streptavidin conjugate. Green = Texas Red channel; Blue = DAPI channel. Scale bar = 20 μm.