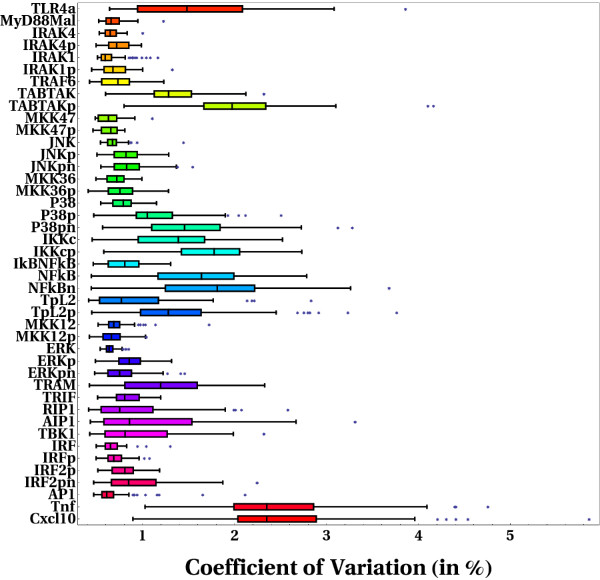
Figure 6.
Spectrum of variabilities for individual dynamical trajectories of each reaction species modeled. Coefficient of variation were calculated for the discrepancies, from reference trajectories, of individual trajectories displayed by each reaction species modeled in the face of global perturbations. Results from only a subset of key reaction species are shown. The results shown correspond to those configurations that were found to be robust to random, simulataneous perturbations.

