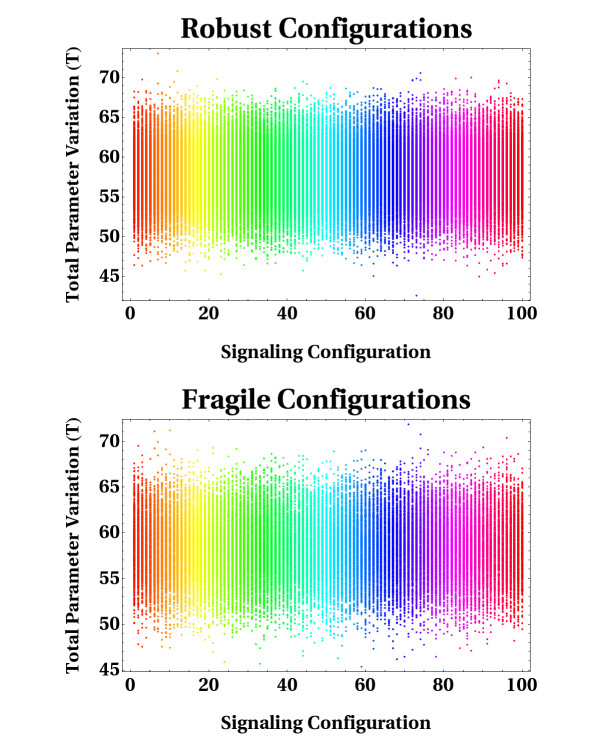
Figure 7.
Spectra of total parameter variation. Total parameter variation (T) represents a measure providing a quantitative notion of the order of magnitude in the variation of a perturbed parameter configuration obtained from a reference one. Two spectra of T values are illustrated, which were assembled for both robust and fragile configurations. Each line of vertical points indicates the distribution of T values calculated when a reference point in parameter space was subject of global perturbations. Note that each spectrum is composed of 100 distributions of T values.

