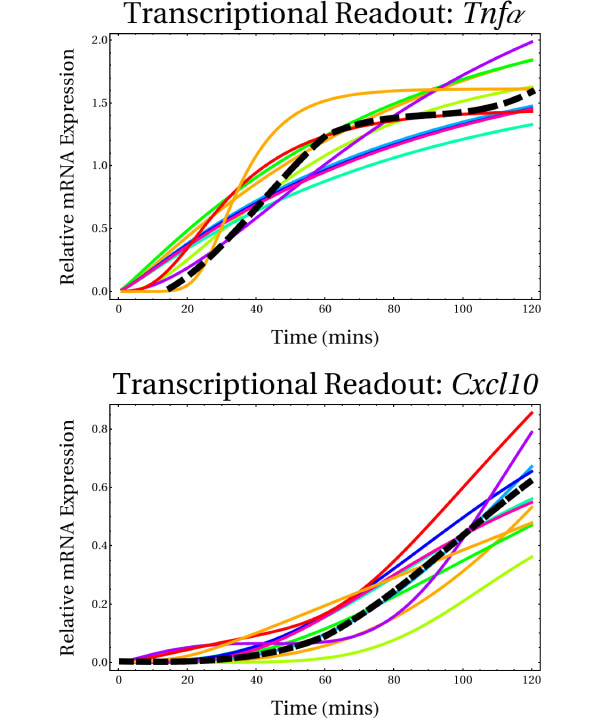
Figure 8.
Experimentally reported and simulated transcriptional readouts. Black dashed trajectories indicate experimentally reported transcriptional activation profiles during a short time window of 120 minutes. Color-coded trajectories stand for simulated trajectories obtained from an extensive exploration of biochemical reaction space by means of Monte Carlo simulations and a pseudo-random search algorithm. Experimental data encompassed only 6 time points that were sampled in cell cultures during the time window of 120 minutes. We performed non-linear interpolation in order to infer the relative expression levels of each gene every minute during the time window. This strategy allowed us to further constrain our simulations.

