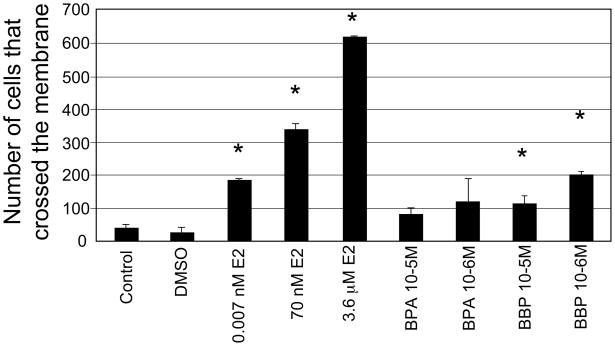
Figure 4. Invasion assay.
The cells that migrated through the membrane were counted after the different treatments: MCF-10F cells treated with 10−5M BPA; 10−6M BPA; 10−5M BBP, 10−6M BBP and, MCF-10F treated with E2 (0.007nM, 70nM or 3.6 μM). As controls, cells were grown in regular media or media with DMSO. Student t-test was used for comparison between treatments and control and a p≤0.01 was accepted as statistically significant. Three replicates were made for each treatment. The mean (±SD) and the statistically significant differences from the control (*) are indicated.

