
Figure 10.
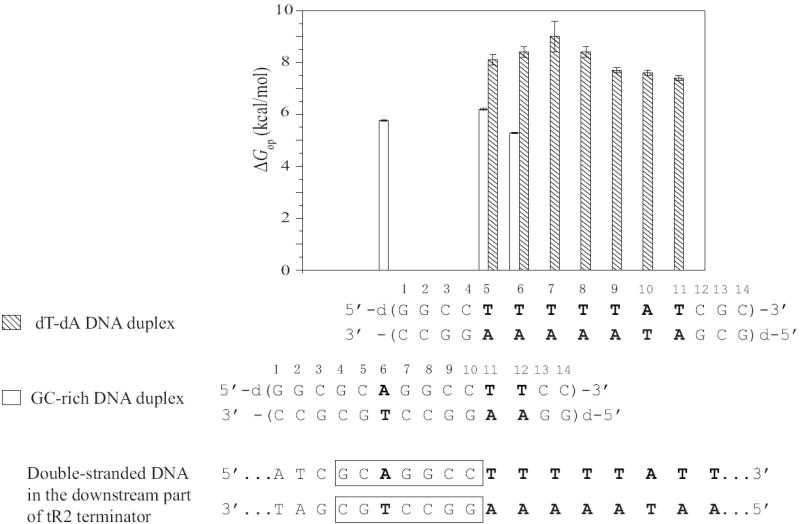
Opening free energy changes (ΔGop in kcal/mol at 10°C) for dT-dA base pairs in the GC-rich and dT-dA DNA duplexes. Empty bars represent the values in the GC-rich duplex, and filled bars represent the values in the dT-dA duplex. The downstream part of the double-stranded DNA in the tR2 terminator is shown at the bottom.