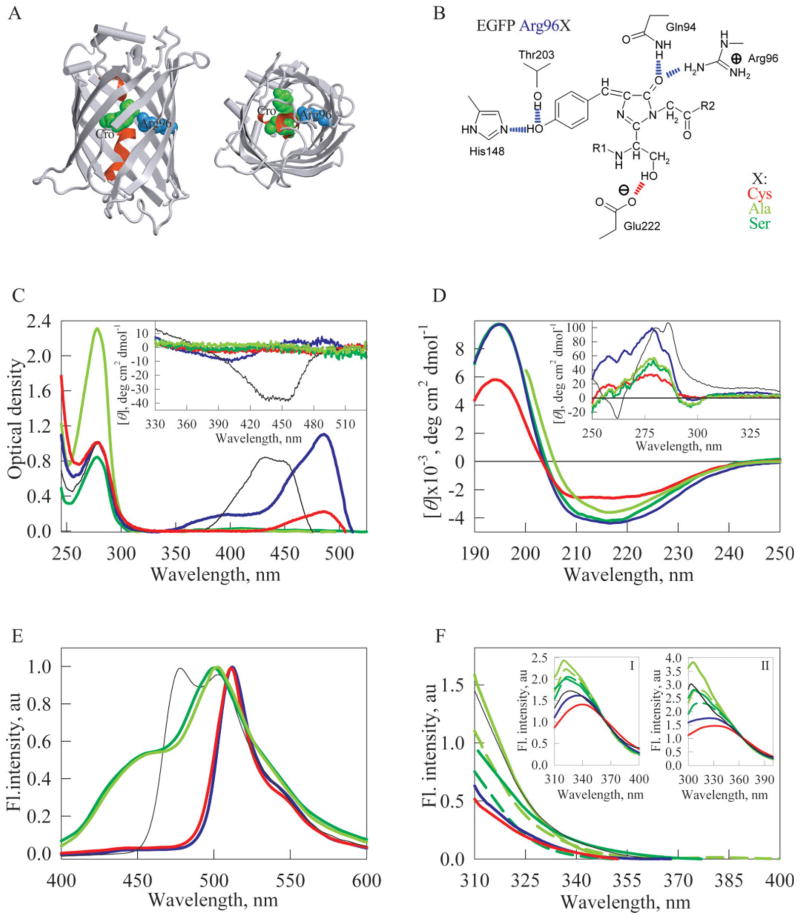
Figure 1.
Spectral properties of the original EGFP and its mutant variants. (A) X-ray crystal structure of Aequorea GFP with S65T and Q80R substitutions [PDB code 1EMA] in two projections. Chromophore is shown as a green space-filling union. A central α-helix which includes chromophore is shown in red. The residue Arg96 is shown in blue. The drawing was generated by the graphic programs VMD5 and Raster3D.6 (B) Some of the interactions of fluorescent protein’s chromophore with the surrounding side chains. Hydrogen bonds are shown in blue, except for the one presumably stabilizing the respective form of the chromophore, which is shown in red. Modified from [Silke Jonda’s Principles of Protein Structure Using Internet project entitled “Structure and Function of GFP” updated on 28.11.96 (http://www.cryst.bbk.ac.uk/PPS2/projects/jonda/)]. (C) UV/VIS absorbance spectra of EGFP (blue line), EGFP/Arg96Cys (red line), EGFP/Arg96Ala (light green line), EGFP/Arg96Ser (green line). Inset represents near UV/VIS spectra of these proteins. (D) Far-UV CD spectra of EGFP (blue line), EGFP/Arg96Cys (red line), EGFP/Arg96Ala (light green line), EGFP/Arg96Ser (green line). Inset: near-UV CD spectra of these proteins. (E) Fluorescence emission spectra of EGFP (blue line), EGFP/Arg96Cys (red line), EGFP/Arg96Ala (light green line), EGFP/Arg96Ser (green line). Spectra have been normalized to have similar maximal intensity. (F) Tryptophan fluorescence spectra of EGFP (blue line), EGFP/Arg96Cys (red line), EGFP/Arg96Ala (light green line), EGFP/Arg96Ser (green line). For EGFP/Arg96Ala and EGFP/Arg96Ser spectra have been measured just after purification (dashed line) and after the incubation for 1 year (solid line). λex = 297 nm.

