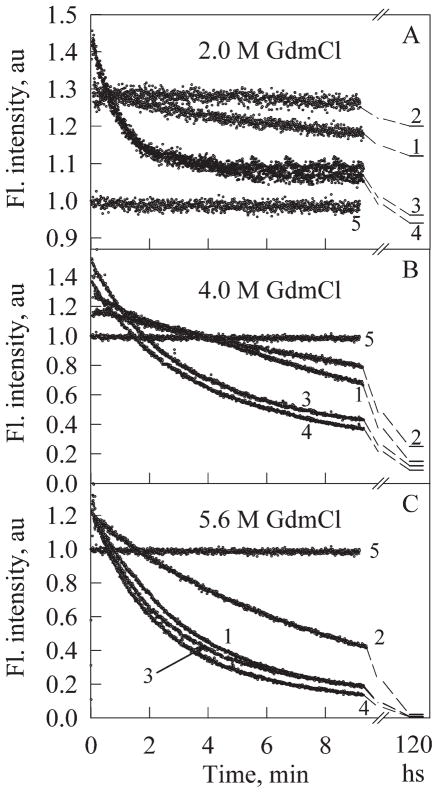
Figure 4.
Kinetics of green fluorescence changes accompanying protein unfolding in 2.0M (A), 4.0M (B), and 5.6M GdmCl (C) for EGFP (1), EGFP/Arg96Cys (2), EGFP/Arg96Ala (3), EGFP/Arg96Ser (4). Kinetic curves for each protein have been normalized to its fluorescence intensity in native state. Curves 5 in Figures 4(A–C) are kinetic dependencies for EGFP in 0M GdmCl.

