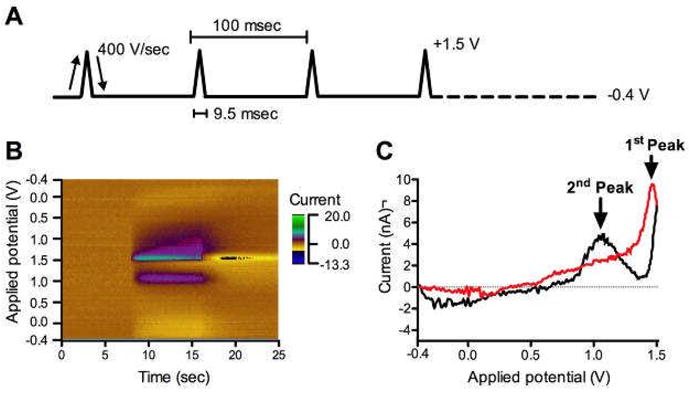
Fig 1.

In vitro adenosine (10 μM) FSCV. A. FSCV waveform. B. The pseudocolor plot exhibits three-dimensional information; each x-, y-axis, and color gradient indicates time, potential waveform applied at the CFM, and currents detected from the CFM, respectively. C. Representative CV of adenosine. Black line is obtained from forward-going potentials and red line is from reverse-going potentials.
