Figure 1.


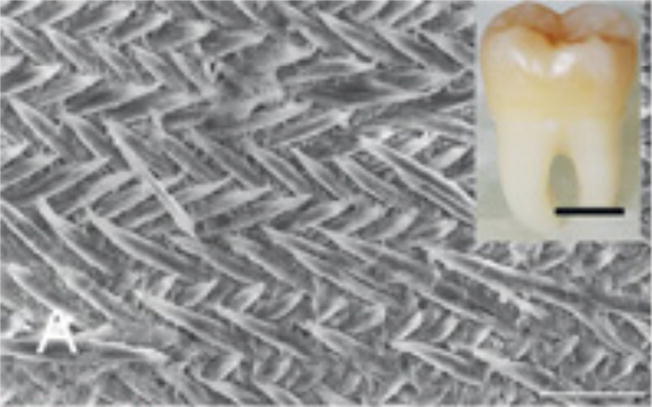
Figure 1A: Scanning electron microscope (SEM) images of etched surface of tooth enamel (mouse incisor) showing the interwoven arrangement of the prisms (scale 10 μm). Inset: A human third molar 6 (scale 1 cm).
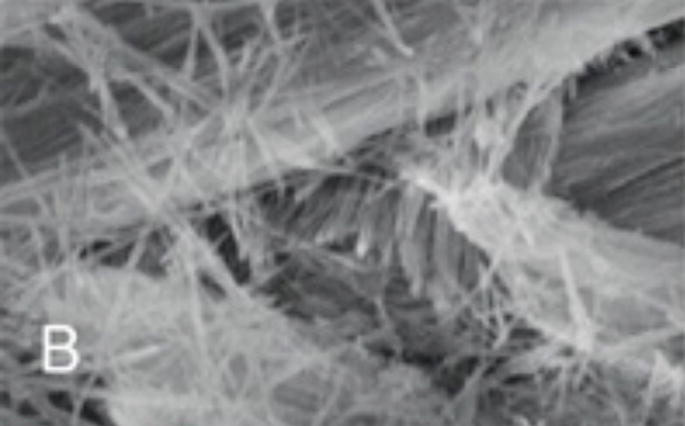
Figure 1B: Higher magnification SEM image showing the calcium fluoridated hydroxyapatite crystals arranged in parallel bundles within the prisms (scale 1 μm).
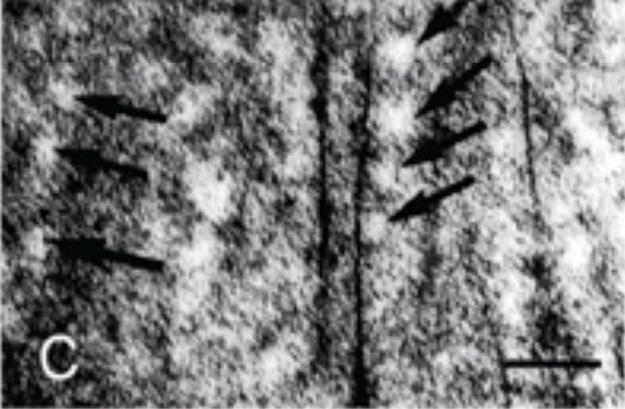
Figure 1C: Transmission electron micrograph of a section of forming enamel (mouse molars) showing the arrangement black lines) within the protein-rich organic matrix (white circles) (scale 50 nanometers).
