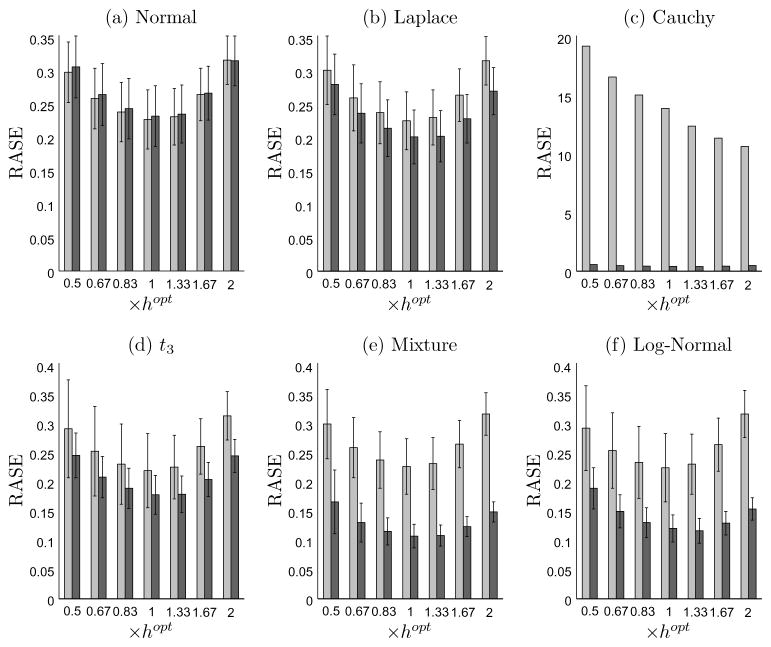
Figure 2.
Bar graphs of the RASE with standard error for sample size n = 800 over 400 simulations. The light gray bar denotes the local least squares method and the dark gray bar denotes the local rank method. The horizontal axis is in the unit of hopt, which is calculated separately for each method and error specification using either (13) or (14).

