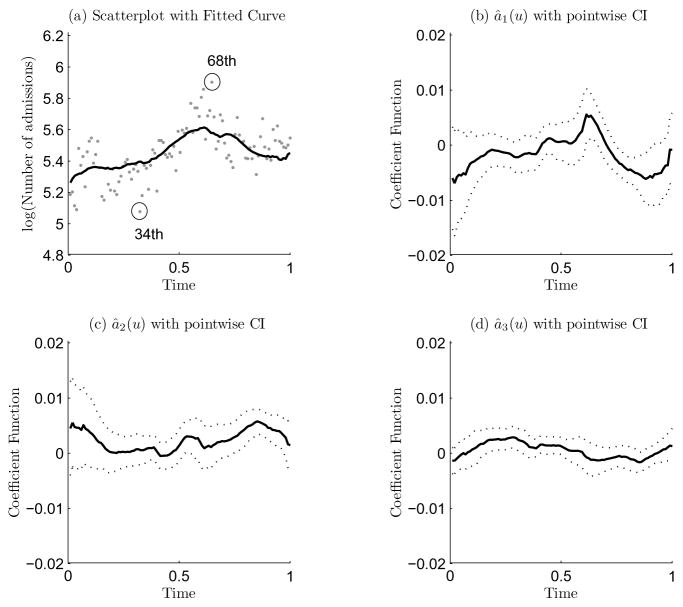
Figure 5.
(a) Scatterplot of the log of number of total hospital admissions over time, and the solid curve is an estimator of the expected log of number of hospital admissions over time at the average pollutant levels, i.e., â0(u) + â1(u)X̄1 + â2(u)X̄2 + â3(u)X̄3, (b), (c) and (d) are the estimated coefficient functions via the local rank estimator for ak(·), k = 1, 2, and 3, respectively.

