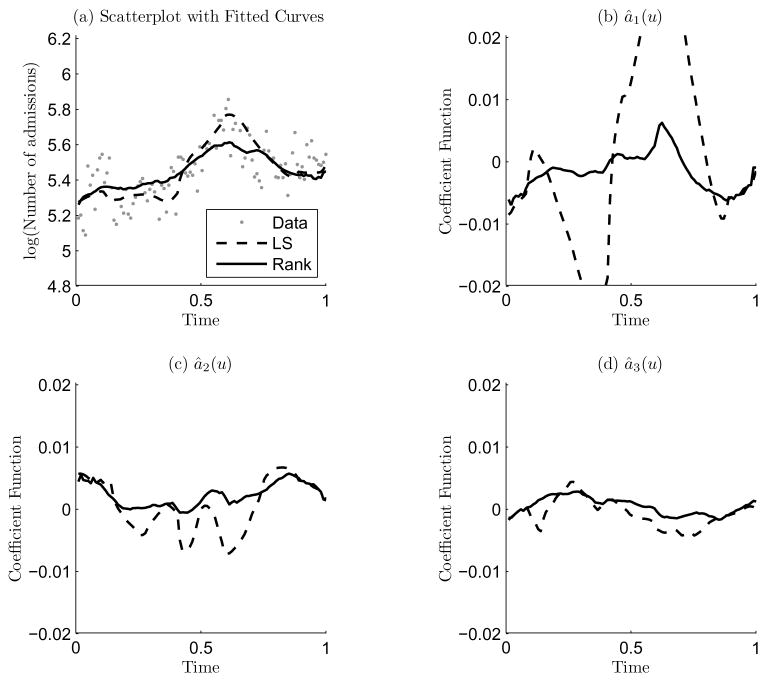
Figure 6.
(a) Scatterplot of the perturbed data (without the two outliers shown as they are outside of the range), and the local LS and the local rank estimators of the expected log of number of hospital admissions. (b), (c) and (d) are the local LS and the rank estimators of the coefficient functions for ak(·), k = 1, 2, and 3, respectively.

