Fig. 2.
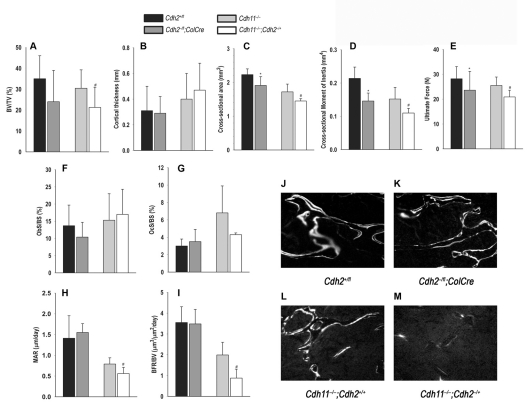
Structural and histomorphometric parameters in cadherin-deficient mice. (A) Quantitative 3D analysis of bone volume/total volume (BV/TV), (B) cortical thickness and (C) cross-sectional area (n=4-5 per group) of mice of different genotypes. (D) Cross-sectional moment of inertia, and (E) ultimate force, determined using a 3-point bending apparatus. When significant, differences are indicated for conditional Cdh2 knockout mice (cKO: Cdh2−/fl;ColCre) relative to wild-type Cdh2+/fl mice, and for Cdh2+/−;Cdh11−/− relative to Cdh11−/− mice. * and # indicate P<0.05 versus relative control. (F) Osteoblast surface (ObS/BS), (G) osteoclast surface (OcS/BS), (H) mineral apposition rate (MAR) and (I) bone formation rate (BFR/BV) in the different genotypes. The last two parameters are lower in Cdh2+/−;Cdh11−/− relative to Cdh11−/− mice (*P<0.05, t-test for unpaired samples). (J,K) Fluorescence micrographs showing double calcein labels in both cKO and their control littermates. (L) Less abundant double labels with mostly single labels are present in Cdh11−/− mice, whereas only rare single labels are seen in Cdh2+/−;Cdh11−/− mice (M).

