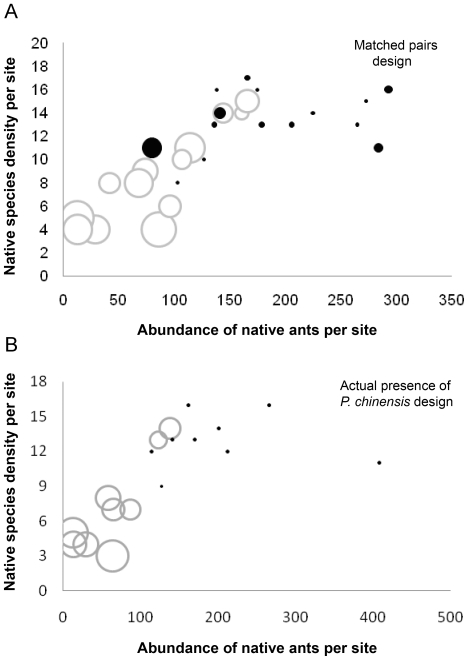
Figure 4. Species density of native ants per site as a function of the abundance of native ants and the presence of P. chinensis.
Sites with P. chinensis are represented by grey circles and sites without P. chinensis are in black. Width of circles is relative to the abundance of P. chinensis found per site (after data transformed with a log +2). (A) Matched pair design (15 paired sites of 13 pitfall traps used for each site). (B) Actual presence of P. chinensis design (9 paired sites with 12 pitfall traps used for each site).

