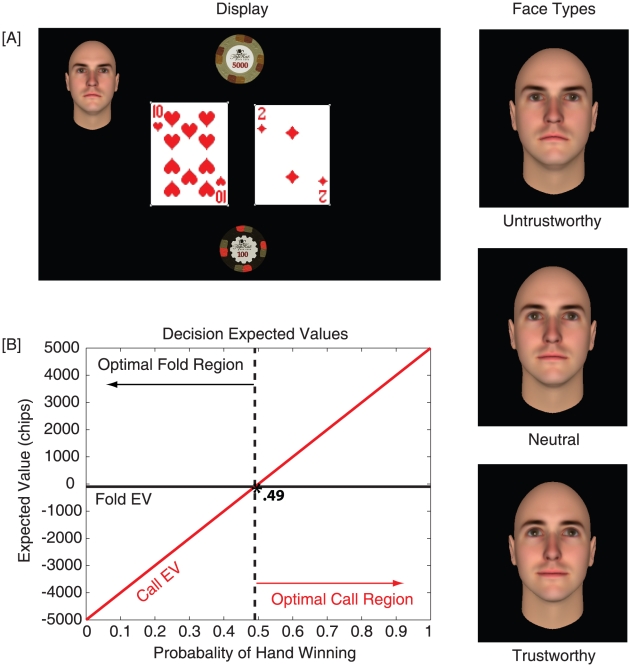
Figure 2. Diagram of the display viewed by participants in this experiment, and expected values for each of the two possible decisions.
[A] Participants played a simplified version of Texas Hold'em poker and were provided information about their starting hand and the opponent who was betting. Based on this information, they were required to make call/fold decisions. If participants choose to fold, they are guaranteed to lose their blind (−100 chips), whereas if they choose to call, they have a chance to either win or lose the bet amount (5000 chips) that is based on the probability of their hand winning against a random opponent. Opponent faces were obtained from an online database [26], [27]. The right column of the figure shows one face identity for three different trustworthiness values. [B] Graph shows how the expected value for each decision changes across starting hands. The ‘optimal decision’ would be the one that results in the greatest expected value. Therefore, participants should fold when the probability of their hand winning is below .49, and call if it is greater. See the Experimental Methods Section for additional details.

