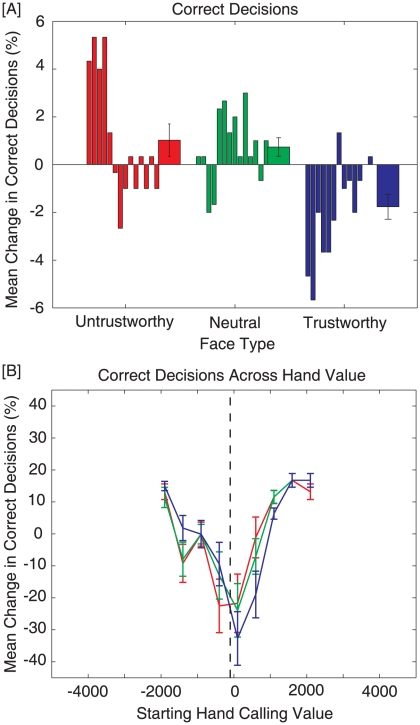
Figure 4. Figure shows changes in correct decisions.
For Panel A, the first 14 bars reflect individual participant data, while the last bar represents the average for each condition (Error bars represent ± SEM). [A] Change in correct decisions across face types. Participants made significantly more mistakes against trustworthy opponents (Blue) than neutral (Green) and untrustworthy (Red) opponents. [B] Mean change in correct decisions across starting-hand value. People did significantly worse (collapsing across trustworthiness conditions) for hands near the optimal decision boundary. Differences between groups were also more pronounced for these mid-value hands.

