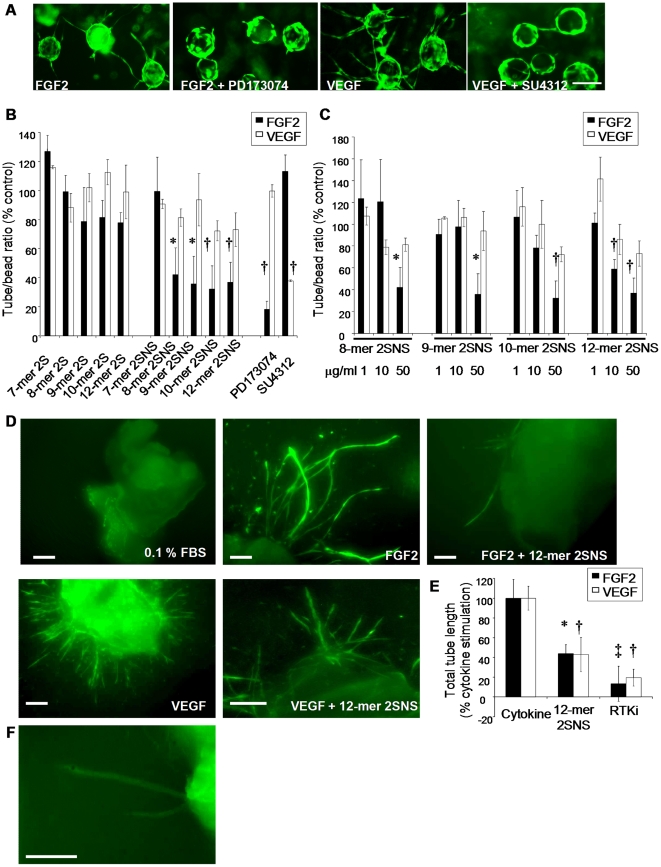
Figure 4. Oligosaccharides inhibit growth factor-induced endothelial tube formation.
(A) HUVEC coated beads were embedded in fibrin gels and treated with either FGF2 or VEGF165 alone or with FGF2 in the presence of PD173074 (0.5 µM) and VEGF165 in the presence of SU4312 (1 µM) for 6 days. Tubes were visualised by staining with Calcein-AM. Scale bar, 100 µm. (B) HUVEC coated beads were treated with FGF2 or VEGF165 mixed with oligosaccharides at 50 µg/ml concentration (equivalent molar concentrations are shown in Table 1). PD173074 and SU4312 were used at 0.5 µM and 1 µM concentration, respectively. The average number of tubes per bead (20–50 beads were evaluated) was quantified. FGF2 or VEGF165 alone treatment represents a control (100%). Percentage in number of tubes per bead in each treatment when compared to the control is shown as mean ± SD (n = 2–4). *, P<0.035; †, P<0.02. (C) Oligosaccharide dose-dependent inhibition of FGF2- or VEGF165-induced endothelial tube formation. Response to 1, 10 and 50 µg/ml concentration (Table 1) of oligosaccharides was evaluated as in B. The mean ± SD (n = 2) is shown. *, P<0.035; †, P<0.02. (D) Mouse aortic rings were embedded in fibrin gels supplemented with the medium with no growth factors (0.1% FBS) or with FGF2, FGF2 plus 12-mer 2SNS (50 µg/ml; 14.7 µM), VEGF165 or VEGF165 plus 12-mer 2SNS (50 µg/ml; 14.7 µM). Tube growth was evaluated after 6 days. Aortas were stained with Calcein-AM. Scale bars, 300 µm. (E) Quantification of total aortic tube length was performed using MetaMorph software and expressed as a percentage of a total tube length induced by the growth factor alone. 12-mer 2SNS was used at 50 µg/ml (14.7 µM), PD173074 at 0.5 µM and SU4312 at 1 µM concentration. RTKi – receptor tyrosine kinase inhibitors. The mean ±SD (n = 3–5) is shown. *, P = 0.01; †, P≤0.003; ‡, P<0.0001. (F) Tubular structures derived from aortas show endothelial cell-specific staining with FITC-conjugated isolectin B4. Scale bar, 300 µm.

