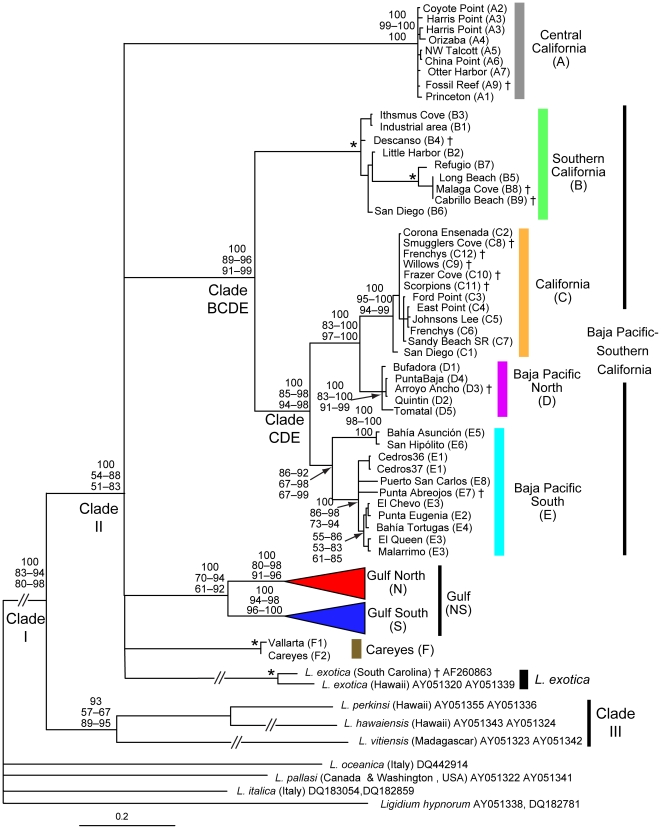
Figure 3. Maximum Likelihood tree of Ligia samples from localities in Figure 1 and several outgroups.
Obtained by RaxML for the 16S rDNA and COI genes (model GTR + G), rooted with Ligidium. Taxon IDs and clade colors correspond to Figure 2. Ligia Gulf clade portion of tree is expanded in Figure 4. Numbers by nodes indicate the corresponding range of node support values obtained for each method: Top-Bayesian Posterior Probabilities; Middle-GARLI bootstrap support; and Bottom-RaxML bootstrap support. * denotes nodes that received 100% support for all methods. Nodes receiving less than 50% support for all methods were collapsed. Nodes with no corresponding support values were of little relevance or had low support values. †: relationship based on 16S sequence only. San Diego (C1): GenBank Acc. Nos. AF260862 and AF255780.

