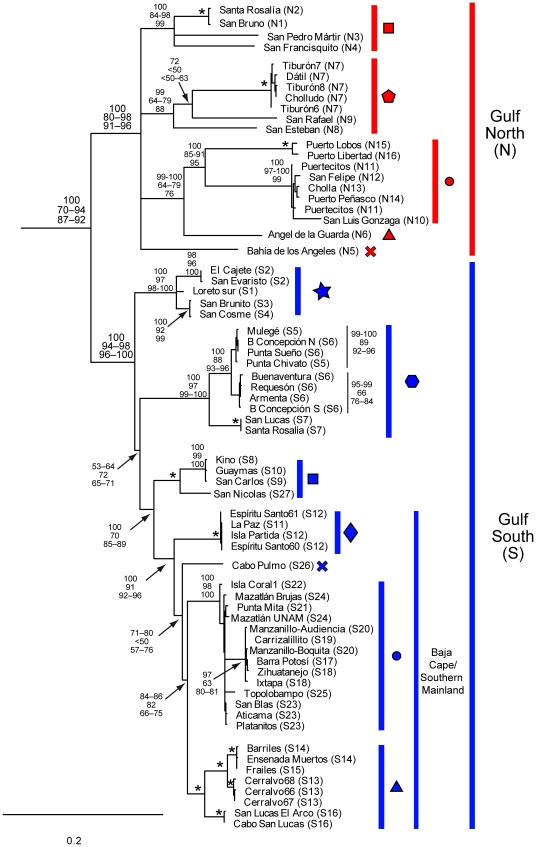
Figure 4. Maximum Likelihood tree of Ligia Gulf samples (expansion of the Gulf clade in Figure 3 ).
Taxon IDs, clade colors and shapes correspond to localities in Figure 2. Numbers by nodes indicate the corresponding range of node support values obtained for each method: Top-Bayesian Posterior Probabilities; Middle-GARLI bootstrap support; and Bottom-RaxML bootstrap support. * denotes nodes that received 100% support for all methods. Nodes receiving less than 50% support for all methods were collapsed. Nodes with no corresponding support values were of little relevance or had low support values.

