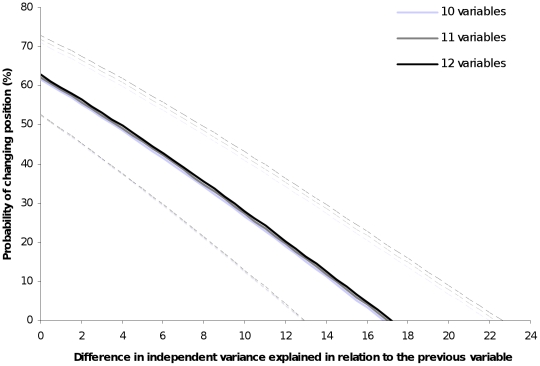
Figure 2. Probability of a variable changing ranking position obtained from the averaged general linear mixed model.
Solid lines: Effect of the difference in independent variance explained (IVE) between a particular variable and the previous one in the ranking (established for explaining the response variable) on the probability of changing the position for data sets formed by 10, 11 and 12 explanatory variables in analysis of hierarchical partitioning. Note that no change is expected when the difference in explained variance between a variable and the previous one in the ranking is >17.1. Dotted lines: upper and lower limits according to the standard error of the averaged mixed-model coefficients.

